29
/es/
es
AIzaSyAYiBZKx7MnpbEhh9jyipgxe19OcubqV5w
April 1, 2024
120134
Djibouti
DJI
true
2
1
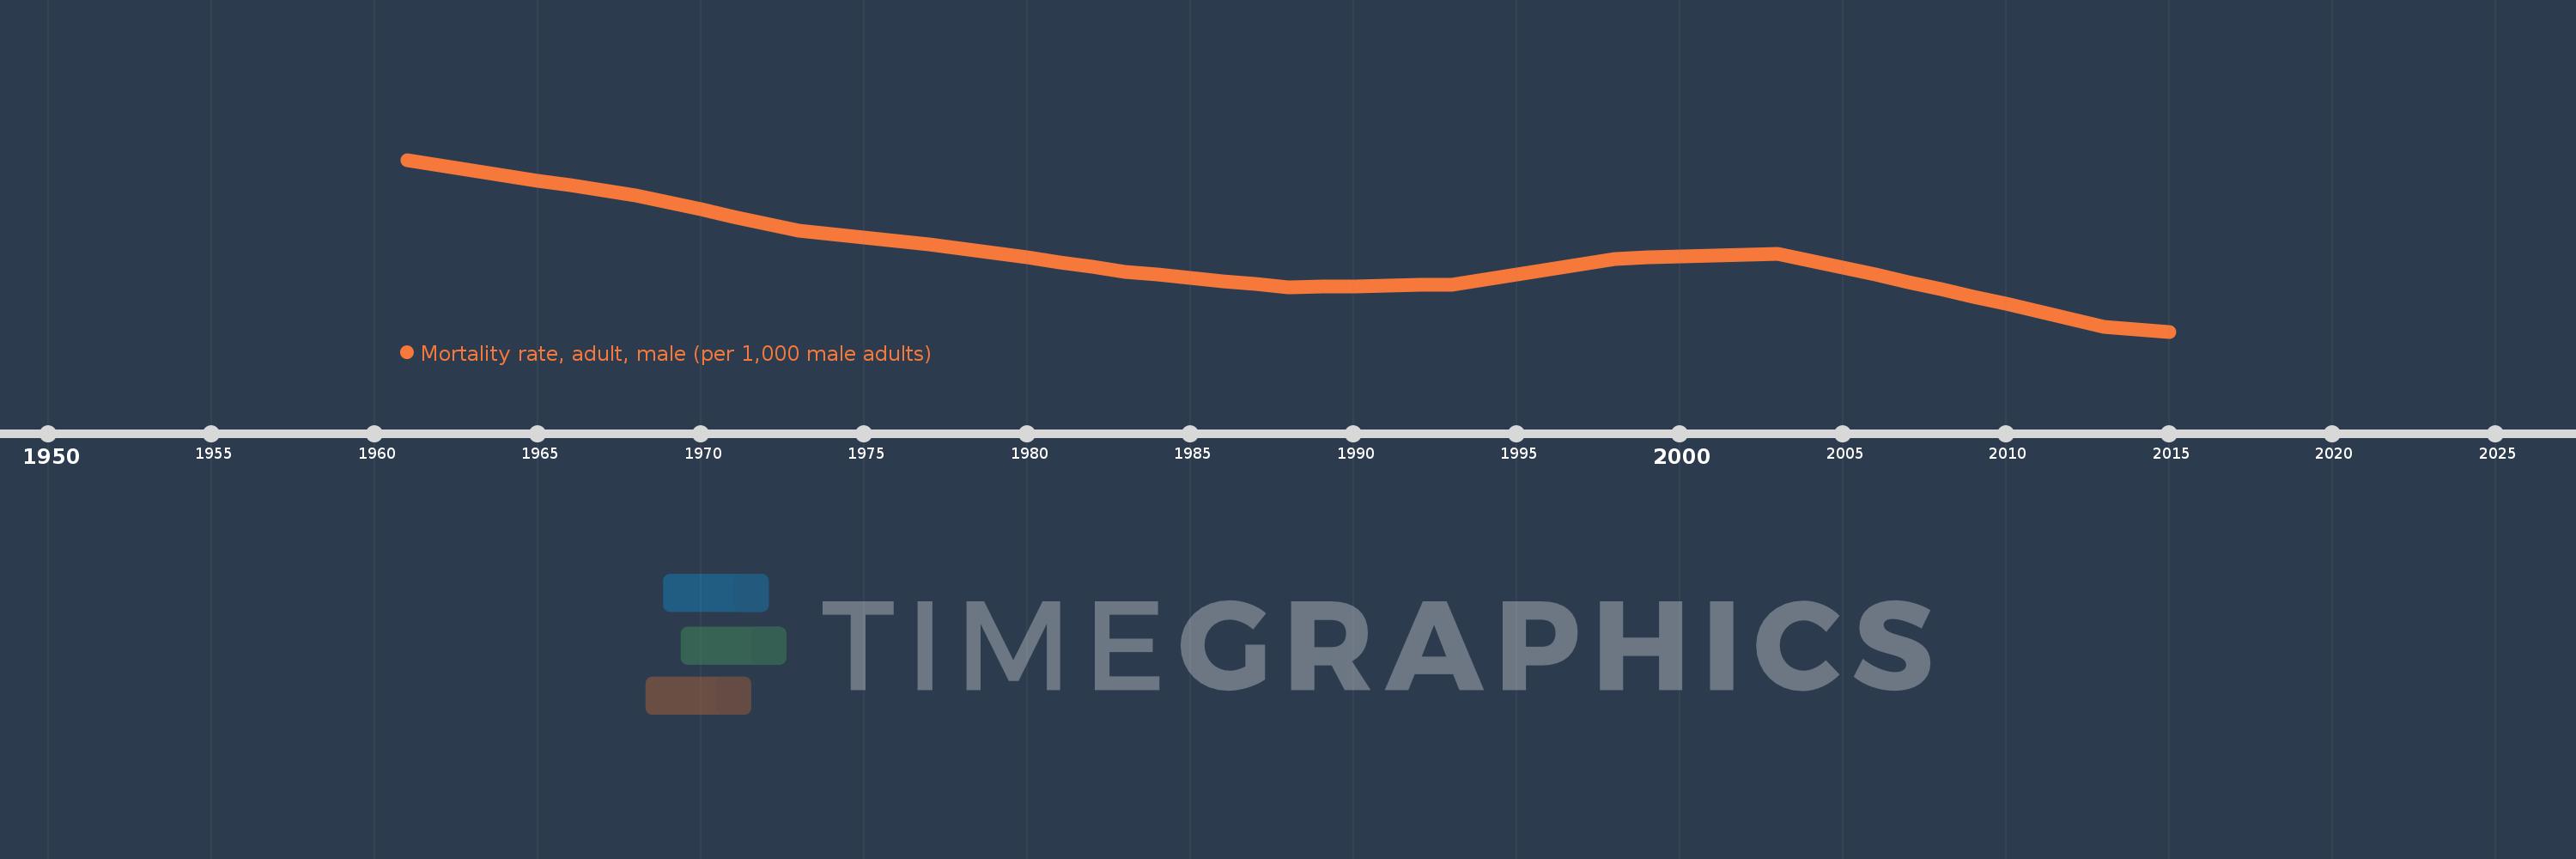
Mortality rate, adult, male (per 1,000 male adults)
2015,2014,2013,2012,2011,2010,2009,2008,2007,2006,2005,2004,2003,2002,2001,2000,1999,1998,1997,1996,1995,1994,1993,1992,1991,1990,1989,1988,1987,1986,1985,1984,1983,1982,1981,1980,1979,1978,1977,1976,1975,1974,1973,1972,1971,1970,1969,1968,1967,1966,1965,1964,1963,1962,1961
Estas estadísticas en otros países:
AfghanistanAlbaniaAlgeriaAngolaAntigua and BarbudaArab WorldArgentinaArmeniaArubaAustraliaAustriaAzerbaijanBahamas, TheBahrainBangladeshBarbadosBelarusBelgiumBelizeBeninBhutanBoliviaBosnia and HerzegovinaBotswanaBrazilBrunei DarussalamBulgariaBurkina FasoBurundiCabo VerdeCambodiaCameroonCanadaCaribbean small statesCentral African RepublicCentral Europe and the BalticsChadChannel IslandsChileChinaColombiaComorosCongo, Dem. Rep.Congo, Rep.Costa RicaCote d'IvoireCroatiaCubaCuracaoCyprusCzech RepublicDenmarkDjiboutiDominicaDominican RepublicEarly-demographic dividendEast Asia & PacificEast Asia & Pacific (excluding high income)East Asia & Pacific (IDA & IBRD countries)EcuadorEgypt, Arab Rep.El SalvadorEquatorial GuineaEritreaEstoniaEthiopiaEuro areaEurope & Central AsiaEurope & Central Asia (excluding high income)Europe & Central Asia (IDA & IBRD countries)European UnionFijiFinlandFragile and conflict affected situationsFranceFrench PolynesiaGabonGambia, TheGeorgiaGermanyGhanaGreeceGreenlandGrenadaGuamGuatemalaGuineaGuinea-BissauGuyanaHaitiHeavily indebted poor countries (HIPC)High incomeHondurasHong Kong SAR, ChinaHungaryIBRD onlyIcelandIDA & IBRD totalIDA blendIDA onlyIDA totalIndiaIndonesiaIran, Islamic Rep.IraqIrelandIsraelItalyJamaicaJapanJordanKazakhstanKenyaKiribatiKorea, Dem. People’s Rep.Korea, Rep.KuwaitKyrgyz RepublicLao PDRLate-demographic dividendLatin America & Caribbean Latin America & Caribbean (excluding high income)Latin America & the Caribbean (IDA & IBRD countries)LatviaLeast developed countries: UN classificationLebanonLesothoLiberiaLibyaLithuaniaLow & middle incomeLow incomeLower middle incomeLuxembourgMacao SAR, ChinaMacedonia, FYRMadagascarMalawiMalaysiaMaldivesMaliMaltaMarshall IslandsMauritaniaMauritiusMexicoMicronesia, Fed. Sts.Middle East & North AfricaMiddle East & North Africa (excluding high income)Middle East & North Africa (IDA & IBRD countries)Middle incomeMoldovaMongoliaMontenegroMoroccoMozambiqueMyanmarNamibiaNepalNetherlandsNew CaledoniaNew ZealandNicaraguaNigerNigeriaNorth AmericaNorwayOECD membersOmanOther small statesPacific island small statesPakistanPanamaPapua New GuineaParaguayPeruPhilippinesPolandPortugalPost-demographic dividendPre-demographic dividendPuerto RicoQatarRomaniaRussian FederationRwandaSamoaSao Tome and PrincipeSaudi ArabiaSenegalSerbiaSeychellesSierra LeoneSingaporeSlovak RepublicSloveniaSmall statesSolomon IslandsSomaliaSouth AfricaSouth AsiaSouth Asia (IDA & IBRD)South SudanSpainSri LankaSt. Kitts and NevisSt. LuciaSt. Vincent and the GrenadinesSub-Saharan Africa Sub-Saharan Africa (excluding high income)Sub-Saharan Africa (IDA & IBRD countries)SudanSurinameSwazilandSwedenSwitzerlandSyrian Arab RepublicTajikistanTanzaniaThailandTimor-LesteTogoTongaTrinidad and TobagoTunisiaTurkeyTurkmenistanUgandaUkraineUnited Arab EmiratesUnited KingdomUnited StatesUpper middle incomeUruguayUzbekistanVanuatuVenezuela, RBVietnamVirgin Islands (U.S.)West Bank and GazaWorldYemen, Rep.ZambiaZimbabwe línea de tiempo (timeline):
En esta escala de tiempo se presenta un gráfico de 1961 y 2015 de Djibouti. Los datos de 1960 están ausentes. El número de observaciones reales por fecha: 55.
Fuente (nombre):
Indicadores del desarrollo mundial
Fuente (organización):
(1) United Nations Population Division. World Population Prospects. New York, United Nations, Department of Economic and Social Affairs (advanced Excel tables). Available at http://esa.un.org/wpp/unpp/panel_population.htm, (2) University of California, Berkeley, and Max Planck Institute for Demographic Research. Human Mortality Database. [ www.mortality.org or www.humanmortality.de].
Categorías:
Health, Gender
Se ha actualizado:
23 abr 2017 año
Los indicadores de los cambios de valor en los últimos años
Mínimo:
276.791
1 ene 2015 año
Máximo:
433.831
1 ene 1961 año
A la fecha de observación
Valor
Cambio absoluto
El cambio con respecto al valor anterior
1 ene 1961 año
433.831
+433.831
0.0%
1 ene 1962 año
428.844
-4.987
-1.15%
1 ene 1963 año
423.857
-4.987
-1.16%
1 ene 1964 año
419.38
-4.477
-1.06%
1 ene 1965 año
414.904
-4.476
-1.07%
1 ene 1966 año
410.428
-4.476
-1.08%
1 ene 1967 año
405.951
-4.477
-1.09%
1 ene 1968 año
401.475
-4.476
-1.1%
1 ene 1969 año
394.97
-6.505
-1.62%
1 ene 1970 año
388.466
-6.504
-1.65%
1 ene 1971 año
381.961
-6.505
-1.67%
1 ene 1972 año
375.456
-6.505
-1.7%
1 ene 1973 año
368.952
-6.504
-1.73%
1 ene 1974 año
365.748
-3.204
-0.87%
1 ene 1975 año
362.545
-3.203
-0.88%
1 ene 1976 año
359.341
-3.204
-0.88%
1 ene 1977 año
356.138
-3.203
-0.89%
1 ene 1978 año
352.935
-3.203
-0.9%
1 ene 1979 año
348.678
-4.257
-1.21%
1 ene 1980 año
344.422
-4.256
-1.22%
1 ene 1981 año
340.165
-4.257
-1.24%
1 ene 1982 año
335.909
-4.256
-1.25%
1 ene 1983 año
331.653
-4.256
-1.27%
1 ene 1984 año
328.79
-2.863
-0.86%
1 ene 1985 año
325.927
-2.863
-0.87%
1 ene 1986 año
323.064
-2.863
-0.88%
1 ene 1987 año
320.201
-2.863
-0.89%
1 ene 1988 año
317.337
-2.864
-0.89%
1 ene 1989 año
317.824
+0.487
0.15%
1 ene 1990 año
318.311
+0.487
0.15%
1 ene 1991 año
318.797
+0.486
0.15%
1 ene 1992 año
319.284
+0.487
0.15%
1 ene 1993 año
319.77
+0.486
0.15%
1 ene 1994 año
324.504
+4.734
1.48%
1 ene 1995 año
329.237
+4.733
1.46%
1 ene 1996 año
333.971
+4.734
1.44%
1 ene 1997 año
338.704
+4.733
1.42%
1 ene 1998 año
343.437
+4.733
1.4%
1 ene 1999 año
344.377
+0.94
0.27%
1 ene 2000 año
345.316
+0.939
0.27%
1 ene 2001 año
346.256
+0.94
0.27%
1 ene 2002 año
347.195
+0.939
0.27%
1 ene 2003 año
348.135
+0.94
0.27%
1 ene 2004 año
341.681
-6.454
-1.85%
1 ene 2005 año
335.228
-6.453
-1.89%
1 ene 2006 año
328.775
-6.453
-1.92%
1 ene 2007 año
322.321
-6.454
-1.96%
1 ene 2008 año
315.868
-6.453
-2.0%
1 ene 2009 año
308.973
-6.895
-2.18%
1 ene 2010 año
302.078
-6.895
-2.23%
1 ene 2011 año
295.183
-6.895
-2.28%
1 ene 2012 año
288.287
-6.896
-2.34%
1 ene 2013 año
281.392
-6.895
-2.39%
1 ene 2014 año
279.092
-2.3
-0.82%
1 ene 2015 año
276.791
-2.301
-0.82%
Ranking de los países por los datos estadísticos actuales


Comentarios: