29
/es/
es
AIzaSyAYiBZKx7MnpbEhh9jyipgxe19OcubqV5w
April 1, 2024
144700
Guatemala
GTM
true
2
1
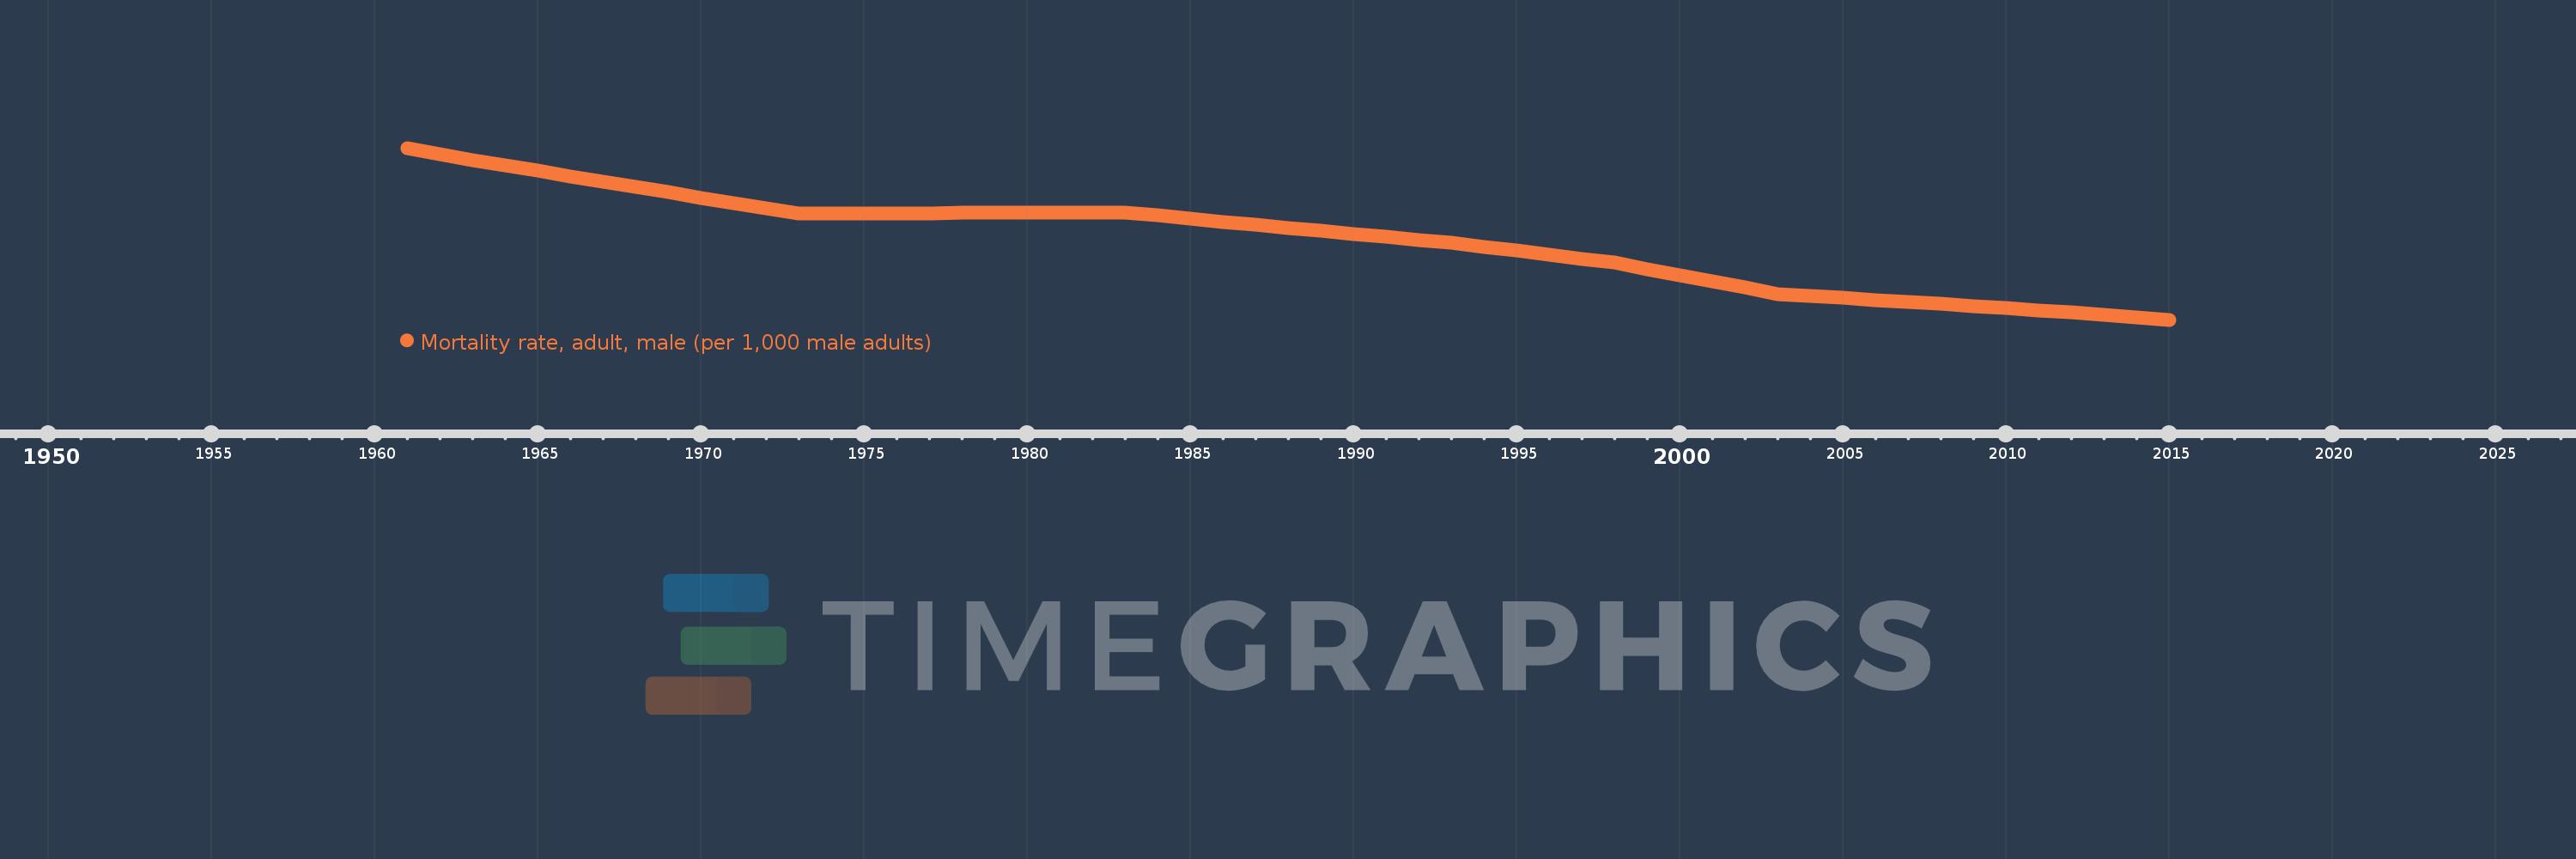
Mortality rate, adult, male (per 1,000 male adults)
2015,2014,2013,2012,2011,2010,2009,2008,2007,2006,2005,2004,2003,2002,2001,2000,1999,1998,1997,1996,1995,1994,1993,1992,1991,1990,1989,1988,1987,1986,1985,1984,1983,1982,1981,1980,1979,1978,1977,1976,1975,1974,1973,1972,1971,1970,1969,1968,1967,1966,1965,1964,1963,1962,1961
Estas estadísticas en otros países:
AfghanistanAlbaniaAlgeriaAngolaAntigua and BarbudaArab WorldArgentinaArmeniaArubaAustraliaAustriaAzerbaijanBahamas, TheBahrainBangladeshBarbadosBelarusBelgiumBelizeBeninBhutanBoliviaBosnia and HerzegovinaBotswanaBrazilBrunei DarussalamBulgariaBurkina FasoBurundiCabo VerdeCambodiaCameroonCanadaCaribbean small statesCentral African RepublicCentral Europe and the BalticsChadChannel IslandsChileChinaColombiaComorosCongo, Dem. Rep.Congo, Rep.Costa RicaCote d'IvoireCroatiaCubaCuracaoCyprusCzech RepublicDenmarkDjiboutiDominicaDominican RepublicEarly-demographic dividendEast Asia & PacificEast Asia & Pacific (excluding high income)East Asia & Pacific (IDA & IBRD countries)EcuadorEgypt, Arab Rep.El SalvadorEquatorial GuineaEritreaEstoniaEthiopiaEuro areaEurope & Central AsiaEurope & Central Asia (excluding high income)Europe & Central Asia (IDA & IBRD countries)European UnionFijiFinlandFragile and conflict affected situationsFranceFrench PolynesiaGabonGambia, TheGeorgiaGermanyGhanaGreeceGreenlandGrenadaGuamGuatemalaGuineaGuinea-BissauGuyanaHaitiHeavily indebted poor countries (HIPC)High incomeHondurasHong Kong SAR, ChinaHungaryIBRD onlyIcelandIDA & IBRD totalIDA blendIDA onlyIDA totalIndiaIndonesiaIran, Islamic Rep.IraqIrelandIsraelItalyJamaicaJapanJordanKazakhstanKenyaKiribatiKorea, Dem. People’s Rep.Korea, Rep.KuwaitKyrgyz RepublicLao PDRLate-demographic dividendLatin America & Caribbean Latin America & Caribbean (excluding high income)Latin America & the Caribbean (IDA & IBRD countries)LatviaLeast developed countries: UN classificationLebanonLesothoLiberiaLibyaLithuaniaLow & middle incomeLow incomeLower middle incomeLuxembourgMacao SAR, ChinaMacedonia, FYRMadagascarMalawiMalaysiaMaldivesMaliMaltaMarshall IslandsMauritaniaMauritiusMexicoMicronesia, Fed. Sts.Middle East & North AfricaMiddle East & North Africa (excluding high income)Middle East & North Africa (IDA & IBRD countries)Middle incomeMoldovaMongoliaMontenegroMoroccoMozambiqueMyanmarNamibiaNepalNetherlandsNew CaledoniaNew ZealandNicaraguaNigerNigeriaNorth AmericaNorwayOECD membersOmanOther small statesPacific island small statesPakistanPanamaPapua New GuineaParaguayPeruPhilippinesPolandPortugalPost-demographic dividendPre-demographic dividendPuerto RicoQatarRomaniaRussian FederationRwandaSamoaSao Tome and PrincipeSaudi ArabiaSenegalSerbiaSeychellesSierra LeoneSingaporeSlovak RepublicSloveniaSmall statesSolomon IslandsSomaliaSouth AfricaSouth AsiaSouth Asia (IDA & IBRD)South SudanSpainSri LankaSt. Kitts and NevisSt. LuciaSt. Vincent and the GrenadinesSub-Saharan Africa Sub-Saharan Africa (excluding high income)Sub-Saharan Africa (IDA & IBRD countries)SudanSurinameSwazilandSwedenSwitzerlandSyrian Arab RepublicTajikistanTanzaniaThailandTimor-LesteTogoTongaTrinidad and TobagoTunisiaTurkeyTurkmenistanUgandaUkraineUnited Arab EmiratesUnited KingdomUnited StatesUpper middle incomeUruguayUzbekistanVanuatuVenezuela, RBVietnamVirgin Islands (U.S.)West Bank and GazaWorldYemen, Rep.ZambiaZimbabwe línea de tiempo (timeline):
En esta escala de tiempo se presenta un gráfico de 1961 y 2015 de Guatemala. Los datos de 1960 están ausentes. El número de observaciones reales por fecha: 55.
Fuente (nombre):
Indicadores del desarrollo mundial
Fuente (organización):
(1) United Nations Population Division. World Population Prospects. New York, United Nations, Department of Economic and Social Affairs (advanced Excel tables). Available at http://esa.un.org/wpp/unpp/panel_population.htm, (2) University of California, Berkeley, and Max Planck Institute for Demographic Research. Human Mortality Database. [ www.mortality.org or www.humanmortality.de].
Categorías:
Health, Gender
Se ha actualizado:
23 abr 2017 año
Los indicadores de los cambios de valor en los últimos años
Mínimo:
236.447
1 ene 2015 año
Máximo:
404.376
1 ene 1961 año
A la fecha de observación
Valor
Cambio absoluto
El cambio con respecto al valor anterior
1 ene 1961 año
404.376
+404.376
0.0%
1 ene 1962 año
398.373
-6.003
-1.48%
1 ene 1963 año
392.369
-6.004
-1.51%
1 ene 1964 año
387.145
-5.224
-1.33%
1 ene 1965 año
381.922
-5.223
-1.35%
1 ene 1966 año
376.698
-5.224
-1.37%
1 ene 1967 año
371.474
-5.224
-1.39%
1 ene 1968 año
366.25
-5.224
-1.41%
1 ene 1969 año
360.992
-5.258
-1.44%
1 ene 1970 año
355.735
-5.257
-1.46%
1 ene 1971 año
350.477
-5.258
-1.48%
1 ene 1972 año
345.22
-5.257
-1.5%
1 ene 1973 año
339.962
-5.258
-1.52%
1 ene 1974 año
340.124
+0.162
0.05%
1 ene 1975 año
340.285
+0.161
0.05%
1 ene 1976 año
340.446
+0.161
0.05%
1 ene 1977 año
340.607
+0.161
0.05%
1 ene 1978 año
340.768
+0.161
0.05%
1 ene 1979 año
340.878
+0.11
0.03%
1 ene 1980 año
340.988
+0.11
0.03%
1 ene 1981 año
341.097
+0.109
0.03%
1 ene 1982 año
341.207
+0.11
0.03%
1 ene 1983 año
341.316
+0.109
0.03%
1 ene 1984 año
338.302
-3.014
-0.88%
1 ene 1985 año
335.288
-3.014
-0.89%
1 ene 1986 año
332.273
-3.015
-0.9%
1 ene 1987 año
329.259
-3.014
-0.91%
1 ene 1988 año
326.245
-3.014
-0.92%
1 ene 1989 año
323.31
-2.935
-0.9%
1 ene 1990 año
320.376
-2.934
-0.91%
1 ene 1991 año
317.442
-2.934
-0.92%
1 ene 1992 año
314.507
-2.935
-0.92%
1 ene 1993 año
311.573
-2.934
-0.93%
1 ene 1994 año
307.7
-3.873
-1.24%
1 ene 1995 año
303.827
-3.873
-1.26%
1 ene 1996 año
299.954
-3.873
-1.27%
1 ene 1997 año
296.081
-3.873
-1.29%
1 ene 1998 año
292.208
-3.873
-1.31%
1 ene 1999 año
286.093
-6.115
-2.09%
1 ene 2000 año
279.978
-6.115
-2.14%
1 ene 2001 año
273.863
-6.115
-2.18%
1 ene 2002 año
267.748
-6.115
-2.23%
1 ene 2003 año
261.633
-6.115
-2.28%
1 ene 2004 año
259.684
-1.949
-0.74%
1 ene 2005 año
257.736
-1.948
-0.75%
1 ene 2006 año
255.787
-1.949
-0.76%
1 ene 2007 año
253.838
-1.949
-0.76%
1 ene 2008 año
251.89
-1.948
-0.77%
1 ene 2009 año
249.763
-2.127
-0.84%
1 ene 2010 año
247.636
-2.127
-0.85%
1 ene 2011 año
245.509
-2.127
-0.86%
1 ene 2012 año
243.382
-2.127
-0.87%
1 ene 2013 año
241.255
-2.127
-0.87%
1 ene 2014 año
238.851
-2.404
-1.0%
1 ene 2015 año
236.447
-2.404
-1.01%
Ranking de los países por los datos estadísticos actuales


Comentarios: