29
/es/
es
AIzaSyAYiBZKx7MnpbEhh9jyipgxe19OcubqV5w
April 1, 2024
86218
Bhutan
BTN
true
2
1
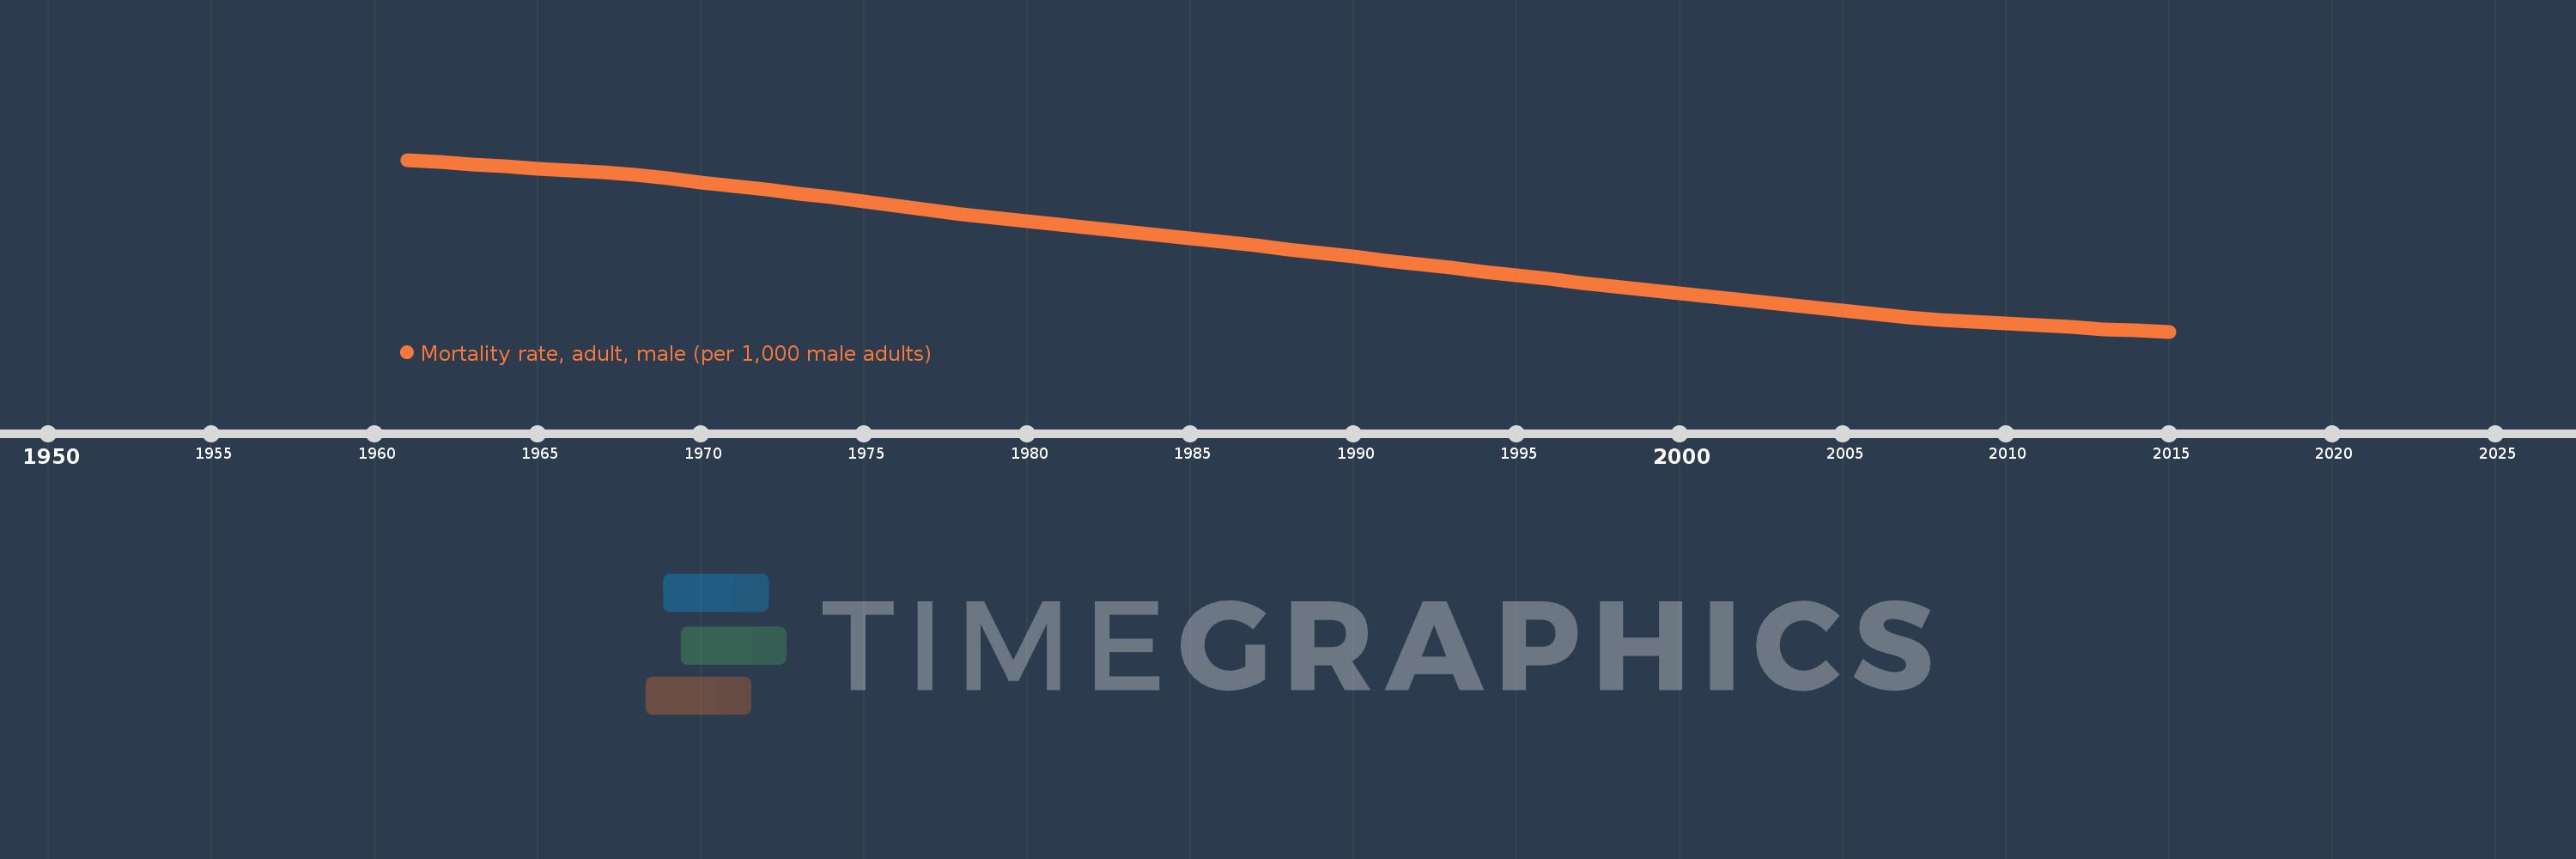
Mortality rate, adult, male (per 1,000 male adults)
2015,2014,2013,2012,2011,2010,2009,2008,2007,2006,2005,2004,2003,2002,2001,2000,1999,1998,1997,1996,1995,1994,1993,1992,1991,1990,1989,1988,1987,1986,1985,1984,1983,1982,1981,1980,1979,1978,1977,1976,1975,1974,1973,1972,1971,1970,1969,1968,1967,1966,1965,1964,1963,1962,1961
Estas estadísticas en otros países:
AfghanistanAlbaniaAlgeriaAngolaAntigua and BarbudaArab WorldArgentinaArmeniaArubaAustraliaAustriaAzerbaijanBahamas, TheBahrainBangladeshBarbadosBelarusBelgiumBelizeBeninBhutanBoliviaBosnia and HerzegovinaBotswanaBrazilBrunei DarussalamBulgariaBurkina FasoBurundiCabo VerdeCambodiaCameroonCanadaCaribbean small statesCentral African RepublicCentral Europe and the BalticsChadChannel IslandsChileChinaColombiaComorosCongo, Dem. Rep.Congo, Rep.Costa RicaCote d'IvoireCroatiaCubaCuracaoCyprusCzech RepublicDenmarkDjiboutiDominicaDominican RepublicEarly-demographic dividendEast Asia & PacificEast Asia & Pacific (excluding high income)East Asia & Pacific (IDA & IBRD countries)EcuadorEgypt, Arab Rep.El SalvadorEquatorial GuineaEritreaEstoniaEthiopiaEuro areaEurope & Central AsiaEurope & Central Asia (excluding high income)Europe & Central Asia (IDA & IBRD countries)European UnionFijiFinlandFragile and conflict affected situationsFranceFrench PolynesiaGabonGambia, TheGeorgiaGermanyGhanaGreeceGreenlandGrenadaGuamGuatemalaGuineaGuinea-BissauGuyanaHaitiHeavily indebted poor countries (HIPC)High incomeHondurasHong Kong SAR, ChinaHungaryIBRD onlyIcelandIDA & IBRD totalIDA blendIDA onlyIDA totalIndiaIndonesiaIran, Islamic Rep.IraqIrelandIsraelItalyJamaicaJapanJordanKazakhstanKenyaKiribatiKorea, Dem. People’s Rep.Korea, Rep.KuwaitKyrgyz RepublicLao PDRLate-demographic dividendLatin America & Caribbean Latin America & Caribbean (excluding high income)Latin America & the Caribbean (IDA & IBRD countries)LatviaLeast developed countries: UN classificationLebanonLesothoLiberiaLibyaLithuaniaLow & middle incomeLow incomeLower middle incomeLuxembourgMacao SAR, ChinaMacedonia, FYRMadagascarMalawiMalaysiaMaldivesMaliMaltaMarshall IslandsMauritaniaMauritiusMexicoMicronesia, Fed. Sts.Middle East & North AfricaMiddle East & North Africa (excluding high income)Middle East & North Africa (IDA & IBRD countries)Middle incomeMoldovaMongoliaMontenegroMoroccoMozambiqueMyanmarNamibiaNepalNetherlandsNew CaledoniaNew ZealandNicaraguaNigerNigeriaNorth AmericaNorwayOECD membersOmanOther small statesPacific island small statesPakistanPanamaPapua New GuineaParaguayPeruPhilippinesPolandPortugalPost-demographic dividendPre-demographic dividendPuerto RicoQatarRomaniaRussian FederationRwandaSamoaSao Tome and PrincipeSaudi ArabiaSenegalSerbiaSeychellesSierra LeoneSingaporeSlovak RepublicSloveniaSmall statesSolomon IslandsSomaliaSouth AfricaSouth AsiaSouth Asia (IDA & IBRD)South SudanSpainSri LankaSt. Kitts and NevisSt. LuciaSt. Vincent and the GrenadinesSub-Saharan Africa Sub-Saharan Africa (excluding high income)Sub-Saharan Africa (IDA & IBRD countries)SudanSurinameSwazilandSwedenSwitzerlandSyrian Arab RepublicTajikistanTanzaniaThailandTimor-LesteTogoTongaTrinidad and TobagoTunisiaTurkeyTurkmenistanUgandaUkraineUnited Arab EmiratesUnited KingdomUnited StatesUpper middle incomeUruguayUzbekistanVanuatuVenezuela, RBVietnamVirgin Islands (U.S.)West Bank and GazaWorldYemen, Rep.ZambiaZimbabwe línea de tiempo (timeline):
En esta escala de tiempo se presenta un gráfico de 1961 y 2015 de Bhutan. Los datos de 1960 están ausentes. El número de observaciones reales por fecha: 55.
Fuente (nombre):
Indicadores del desarrollo mundial
Fuente (organización):
(1) United Nations Population Division. World Population Prospects. New York, United Nations, Department of Economic and Social Affairs (advanced Excel tables). Available at http://esa.un.org/wpp/unpp/panel_population.htm, (2) University of California, Berkeley, and Max Planck Institute for Demographic Research. Human Mortality Database. [ www.mortality.org or www.humanmortality.de].
Categorías:
Health, Gender
Se ha actualizado:
23 abr 2017 año
Los indicadores de los cambios de valor en los últimos años
Mínimo:
209.74
1 ene 2015 año
Máximo:
602.098
1 ene 1961 año
A la fecha de observación
Valor
Cambio absoluto
El cambio con respecto al valor anterior
1 ene 1961 año
602.098
+602.098
0.0%
1 ene 1962 año
597.089
-5.009
-0.83%
1 ene 1963 año
592.08
-5.009
-0.84%
1 ene 1964 año
587.234
-4.846
-0.82%
1 ene 1965 año
582.389
-4.845
-0.83%
1 ene 1966 año
577.544
-4.845
-0.83%
1 ene 1967 año
572.699
-4.845
-0.84%
1 ene 1968 año
567.854
-4.845
-0.85%
1 ene 1969 año
559.373
-8.481
-1.49%
1 ene 1970 año
550.892
-8.481
-1.52%
1 ene 1971 año
542.412
-8.48
-1.54%
1 ene 1972 año
533.931
-8.481
-1.56%
1 ene 1973 año
525.45
-8.481
-1.59%
1 ene 1974 año
515.985
-9.465
-1.8%
1 ene 1975 año
506.519
-9.466
-1.83%
1 ene 1976 año
497.053
-9.466
-1.87%
1 ene 1977 año
487.588
-9.465
-1.9%
1 ene 1978 año
478.122
-9.466
-1.94%
1 ene 1979 año
470.028
-8.094
-1.69%
1 ene 1980 año
461.933
-8.095
-1.72%
1 ene 1981 año
453.839
-8.094
-1.75%
1 ene 1982 año
445.745
-8.094
-1.78%
1 ene 1983 año
437.651
-8.094
-1.82%
1 ene 1984 año
429.732
-7.919
-1.81%
1 ene 1985 año
421.814
-7.918
-1.84%
1 ene 1986 año
413.896
-7.918
-1.88%
1 ene 1987 año
405.978
-7.918
-1.91%
1 ene 1988 año
398.059
-7.919
-1.95%
1 ene 1989 año
389.502
-8.557
-2.15%
1 ene 1990 año
380.945
-8.557
-2.2%
1 ene 1991 año
372.388
-8.557
-2.25%
1 ene 1992 año
363.832
-8.556
-2.3%
1 ene 1993 año
355.275
-8.557
-2.35%
1 ene 1994 año
346.786
-8.489
-2.39%
1 ene 1995 año
338.298
-8.488
-2.45%
1 ene 1996 año
329.81
-8.488
-2.51%
1 ene 1997 año
321.322
-8.488
-2.57%
1 ene 1998 año
312.834
-8.488
-2.64%
1 ene 1999 año
304.866
-7.968
-2.55%
1 ene 2000 año
296.899
-7.967
-2.61%
1 ene 2001 año
288.931
-7.968
-2.68%
1 ene 2002 año
280.963
-7.968
-2.76%
1 ene 2003 año
272.996
-7.967
-2.84%
1 ene 2004 año
265.481
-7.515
-2.75%
1 ene 2005 año
257.967
-7.514
-2.83%
1 ene 2006 año
250.452
-7.515
-2.91%
1 ene 2007 año
242.938
-7.514
-3.0%
1 ene 2008 año
235.423
-7.515
-3.09%
1 ene 2009 año
231.46
-3.963
-1.68%
1 ene 2010 año
227.497
-3.963
-1.71%
1 ene 2011 año
223.534
-3.963
-1.74%
1 ene 2012 año
219.571
-3.963
-1.77%
1 ene 2013 año
215.608
-3.963
-1.8%
1 ene 2014 año
212.674
-2.934
-1.36%
1 ene 2015 año
209.74
-2.934
-1.38%
Ranking de los países por los datos estadísticos actuales


Comentarios: