29
/es/
es
AIzaSyAYiBZKx7MnpbEhh9jyipgxe19OcubqV5w
April 1, 2024
245917
South Africa
ZAF
true
2
1
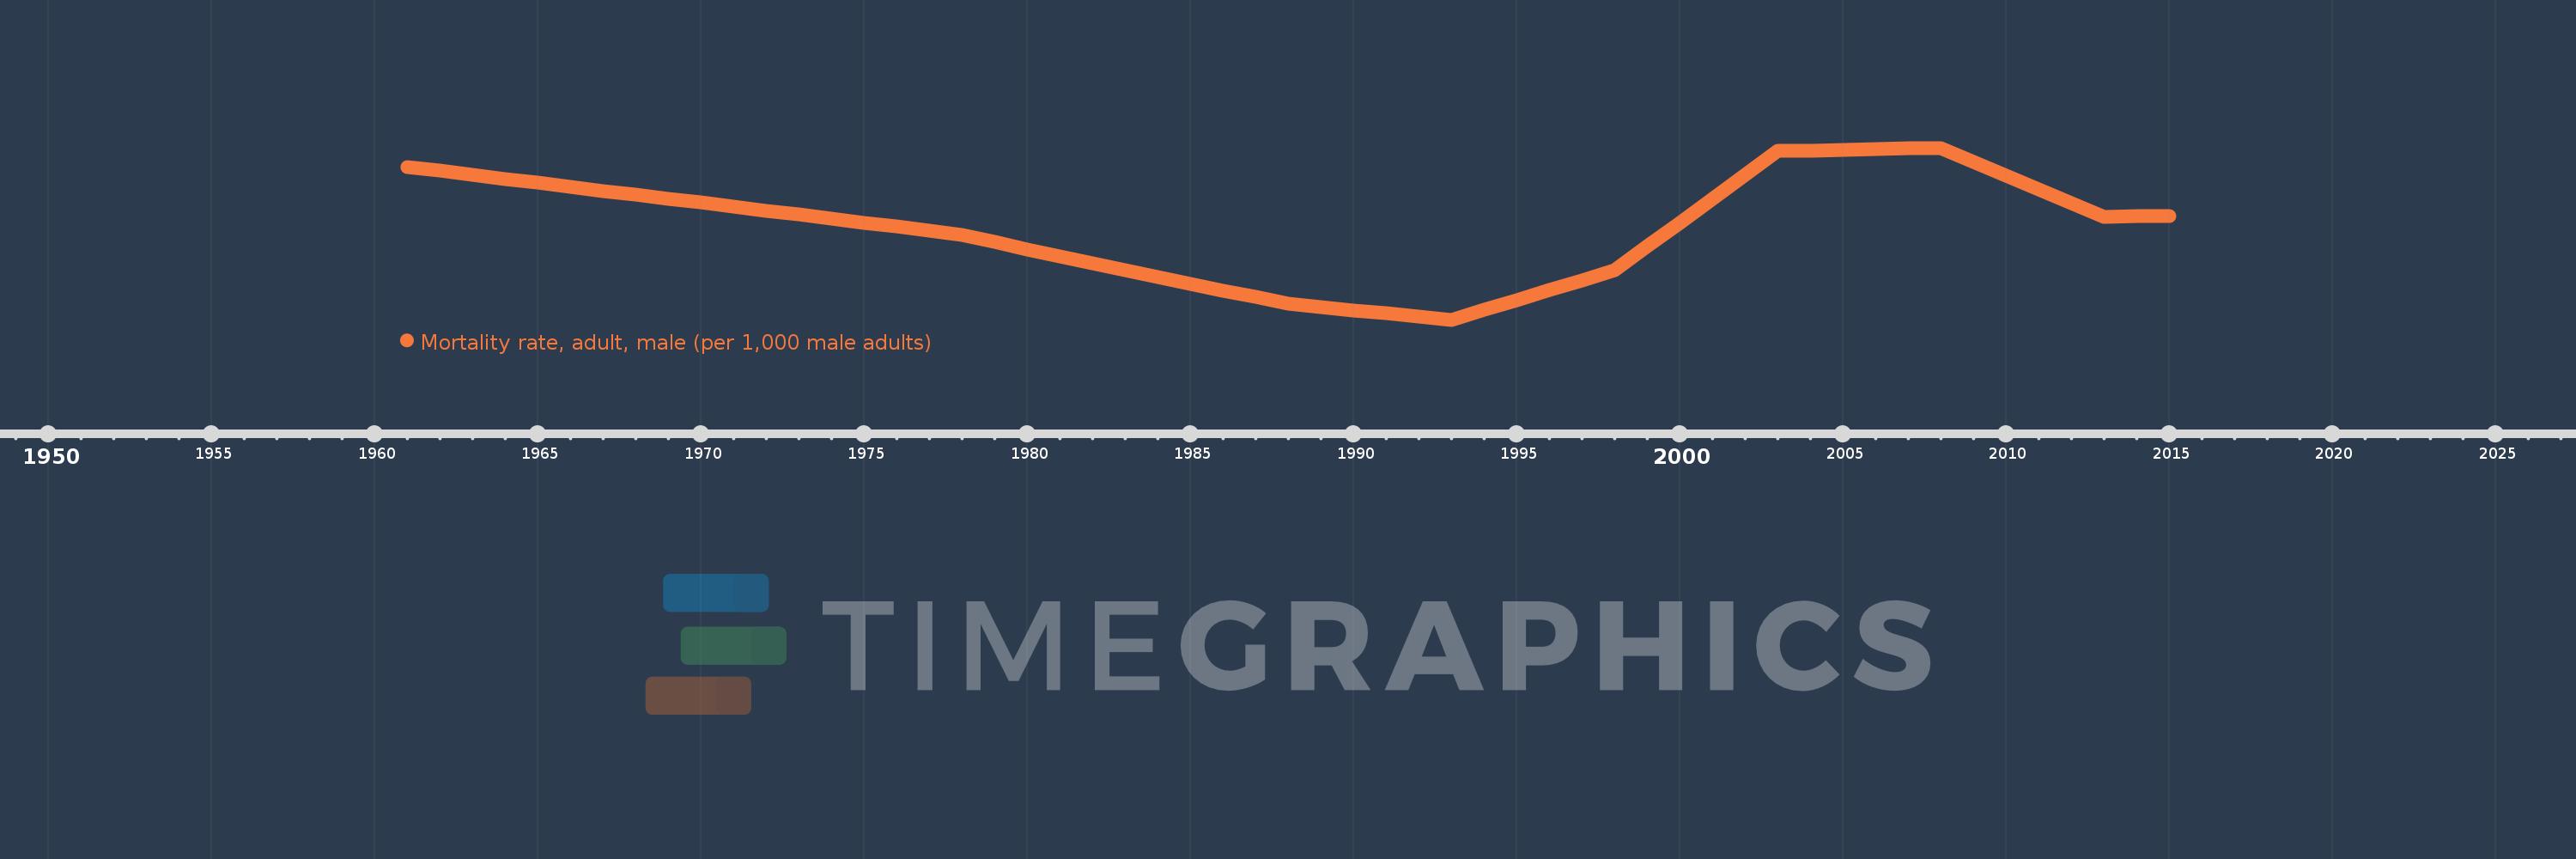
Mortality rate, adult, male (per 1,000 male adults)
2015,2014,2013,2012,2011,2010,2009,2008,2007,2006,2005,2004,2003,2002,2001,2000,1999,1998,1997,1996,1995,1994,1993,1992,1991,1990,1989,1988,1987,1986,1985,1984,1983,1982,1981,1980,1979,1978,1977,1976,1975,1974,1973,1972,1971,1970,1969,1968,1967,1966,1965,1964,1963,1962,1961
Estas estadísticas en otros países:
AfghanistanAlbaniaAlgeriaAngolaAntigua and BarbudaArab WorldArgentinaArmeniaArubaAustraliaAustriaAzerbaijanBahamas, TheBahrainBangladeshBarbadosBelarusBelgiumBelizeBeninBhutanBoliviaBosnia and HerzegovinaBotswanaBrazilBrunei DarussalamBulgariaBurkina FasoBurundiCabo VerdeCambodiaCameroonCanadaCaribbean small statesCentral African RepublicCentral Europe and the BalticsChadChannel IslandsChileChinaColombiaComorosCongo, Dem. Rep.Congo, Rep.Costa RicaCote d'IvoireCroatiaCubaCuracaoCyprusCzech RepublicDenmarkDjiboutiDominicaDominican RepublicEarly-demographic dividendEast Asia & PacificEast Asia & Pacific (excluding high income)East Asia & Pacific (IDA & IBRD countries)EcuadorEgypt, Arab Rep.El SalvadorEquatorial GuineaEritreaEstoniaEthiopiaEuro areaEurope & Central AsiaEurope & Central Asia (excluding high income)Europe & Central Asia (IDA & IBRD countries)European UnionFijiFinlandFragile and conflict affected situationsFranceFrench PolynesiaGabonGambia, TheGeorgiaGermanyGhanaGreeceGreenlandGrenadaGuamGuatemalaGuineaGuinea-BissauGuyanaHaitiHeavily indebted poor countries (HIPC)High incomeHondurasHong Kong SAR, ChinaHungaryIBRD onlyIcelandIDA & IBRD totalIDA blendIDA onlyIDA totalIndiaIndonesiaIran, Islamic Rep.IraqIrelandIsraelItalyJamaicaJapanJordanKazakhstanKenyaKiribatiKorea, Dem. People’s Rep.Korea, Rep.KuwaitKyrgyz RepublicLao PDRLate-demographic dividendLatin America & Caribbean Latin America & Caribbean (excluding high income)Latin America & the Caribbean (IDA & IBRD countries)LatviaLeast developed countries: UN classificationLebanonLesothoLiberiaLibyaLithuaniaLow & middle incomeLow incomeLower middle incomeLuxembourgMacao SAR, ChinaMacedonia, FYRMadagascarMalawiMalaysiaMaldivesMaliMaltaMarshall IslandsMauritaniaMauritiusMexicoMicronesia, Fed. Sts.Middle East & North AfricaMiddle East & North Africa (excluding high income)Middle East & North Africa (IDA & IBRD countries)Middle incomeMoldovaMongoliaMontenegroMoroccoMozambiqueMyanmarNamibiaNepalNetherlandsNew CaledoniaNew ZealandNicaraguaNigerNigeriaNorth AmericaNorwayOECD membersOmanOther small statesPacific island small statesPakistanPanamaPapua New GuineaParaguayPeruPhilippinesPolandPortugalPost-demographic dividendPre-demographic dividendPuerto RicoQatarRomaniaRussian FederationRwandaSamoaSao Tome and PrincipeSaudi ArabiaSenegalSerbiaSeychellesSierra LeoneSingaporeSlovak RepublicSloveniaSmall statesSolomon IslandsSomaliaSouth AfricaSouth AsiaSouth Asia (IDA & IBRD)South SudanSpainSri LankaSt. Kitts and NevisSt. LuciaSt. Vincent and the GrenadinesSub-Saharan Africa Sub-Saharan Africa (excluding high income)Sub-Saharan Africa (IDA & IBRD countries)SudanSurinameSwazilandSwedenSwitzerlandSyrian Arab RepublicTajikistanTanzaniaThailandTimor-LesteTogoTongaTrinidad and TobagoTunisiaTurkeyTurkmenistanUgandaUkraineUnited Arab EmiratesUnited KingdomUnited StatesUpper middle incomeUruguayUzbekistanVanuatuVenezuela, RBVietnamVirgin Islands (U.S.)West Bank and GazaWorldYemen, Rep.ZambiaZimbabwe línea de tiempo (timeline):
En esta escala de tiempo se presenta un gráfico de 1961 y 2015 de South Africa. Los datos de 1960 están ausentes. El número de observaciones reales por fecha: 55.
Fuente (nombre):
Indicadores del desarrollo mundial
Fuente (organización):
(1) United Nations Population Division. World Population Prospects. New York, United Nations, Department of Economic and Social Affairs (advanced Excel tables). Available at http://esa.un.org/wpp/unpp/panel_population.htm, (2) University of California, Berkeley, and Max Planck Institute for Demographic Research. Human Mortality Database. [ www.mortality.org or www.humanmortality.de].
Categorías:
Health, Gender
Se ha actualizado:
23 abr 2017 año
Los indicadores de los cambios de valor en los últimos años
Mínimo:
344.902
1 ene 1993 año
Máximo:
542.132
1 ene 2008 año
A la fecha de observación
Valor
Cambio absoluto
El cambio con respecto al valor anterior
1 ene 1961 año
520.319
+520.319
0.0%
1 ene 1962 año
515.836
-4.483
-0.86%
1 ene 1963 año
511.354
-4.482
-0.87%
1 ene 1964 año
506.747
-4.607
-0.9%
1 ene 1965 año
502.141
-4.606
-0.91%
1 ene 1966 año
497.535
-4.606
-0.92%
1 ene 1967 año
492.928
-4.607
-0.93%
1 ene 1968 año
488.322
-4.606
-0.93%
1 ene 1969 año
483.778
-4.544
-0.93%
1 ene 1970 año
479.234
-4.544
-0.94%
1 ene 1971 año
474.69
-4.544
-0.95%
1 ene 1972 año
470.146
-4.544
-0.96%
1 ene 1973 año
465.602
-4.544
-0.97%
1 ene 1974 año
460.942
-4.66
-1.0%
1 ene 1975 año
456.282
-4.66
-1.01%
1 ene 1976 año
451.622
-4.66
-1.02%
1 ene 1977 año
446.962
-4.66
-1.03%
1 ene 1978 año
442.302
-4.66
-1.04%
1 ene 1979 año
434.113
-8.189
-1.85%
1 ene 1980 año
425.923
-8.19
-1.89%
1 ene 1981 año
417.734
-8.189
-1.92%
1 ene 1982 año
409.544
-8.19
-1.96%
1 ene 1983 año
401.355
-8.189
-2.0%
1 ene 1984 año
393.732
-7.623
-1.9%
1 ene 1985 año
386.109
-7.623
-1.94%
1 ene 1986 año
378.486
-7.623
-1.97%
1 ene 1987 año
370.863
-7.623
-2.01%
1 ene 1988 año
363.24
-7.623
-2.06%
1 ene 1989 año
359.572
-3.668
-1.01%
1 ene 1990 año
355.905
-3.667
-1.02%
1 ene 1991 año
352.237
-3.668
-1.03%
1 ene 1992 año
348.57
-3.667
-1.04%
1 ene 1993 año
344.902
-3.668
-1.05%
1 ene 1994 año
356.261
+11.359
3.29%
1 ene 1995 año
367.62
+11.359
3.19%
1 ene 1996 año
378.98
+11.36
3.09%
1 ene 1997 año
390.339
+11.359
3.0%
1 ene 1998 año
401.698
+11.359
2.91%
1 ene 1999 año
429.085
+27.387
6.82%
1 ene 2000 año
456.472
+27.387
6.38%
1 ene 2001 año
483.859
+27.387
6.0%
1 ene 2002 año
511.246
+27.387
5.66%
1 ene 2003 año
538.632
+27.386
5.36%
1 ene 2004 año
539.332
+0.7
0.13%
1 ene 2005 año
540.032
+0.7
0.13%
1 ene 2006 año
540.732
+0.7
0.13%
1 ene 2007 año
541.432
+0.7
0.13%
1 ene 2008 año
542.132
+0.7
0.13%
1 ene 2009 año
526.34
-15.792
-2.91%
1 ene 2010 año
510.547
-15.793
-3.0%
1 ene 2011 año
494.755
-15.792
-3.09%
1 ene 2012 año
478.963
-15.792
-3.19%
1 ene 2013 año
463.171
-15.792
-3.3%
1 ene 2014 año
463.632
+0.461
0.1%
1 ene 2015 año
464.093
+0.461
0.1%
Ranking de los países por los datos estadísticos actuales


Comentarios: