29
/es/
es
AIzaSyAYiBZKx7MnpbEhh9jyipgxe19OcubqV5w
April 1, 2024
140707
Ghana
GHA
true
2
1
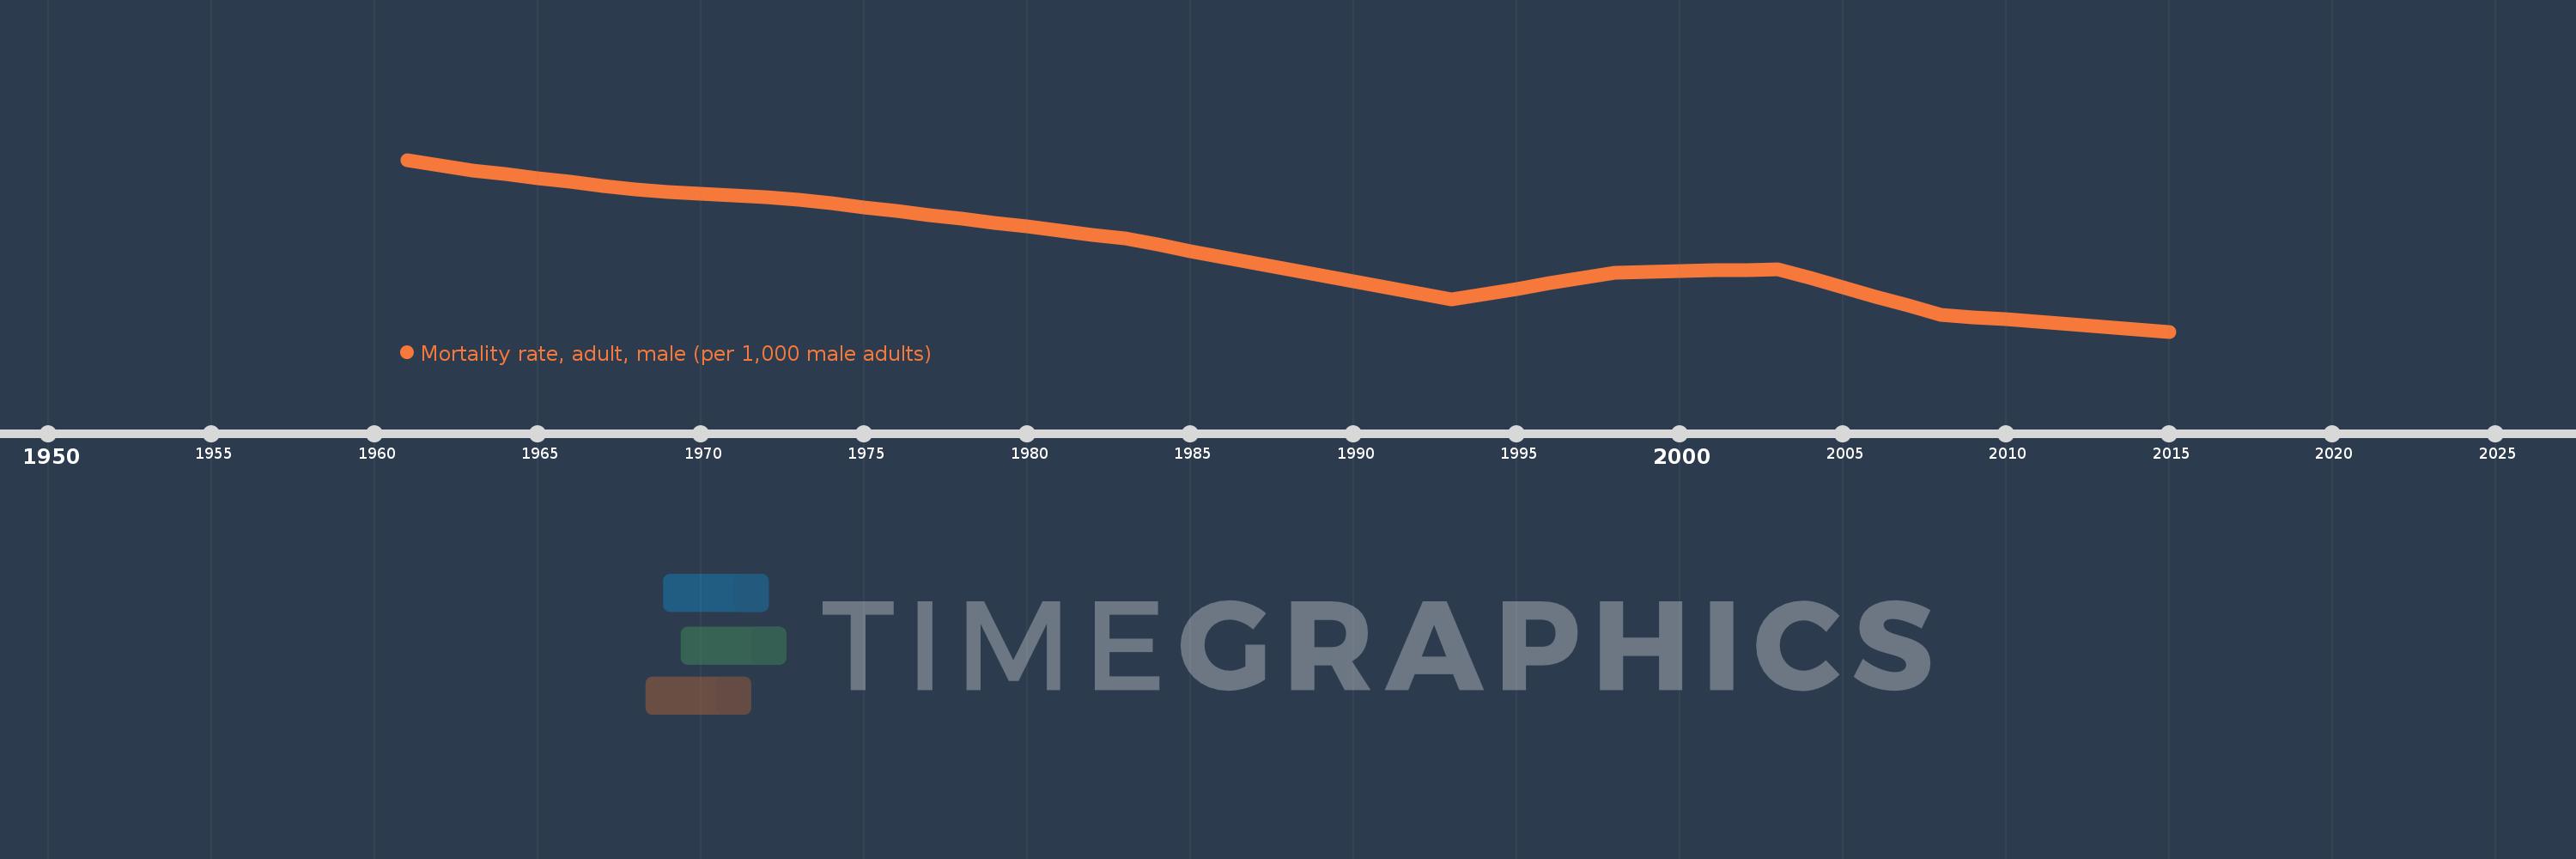
Mortality rate, adult, male (per 1,000 male adults)
2015,2014,2013,2012,2011,2010,2009,2008,2007,2006,2005,2004,2003,2002,2001,2000,1999,1998,1997,1996,1995,1994,1993,1992,1991,1990,1989,1988,1987,1986,1985,1984,1983,1982,1981,1980,1979,1978,1977,1976,1975,1974,1973,1972,1971,1970,1969,1968,1967,1966,1965,1964,1963,1962,1961
Estas estadísticas en otros países:
AfghanistanAlbaniaAlgeriaAngolaAntigua and BarbudaArab WorldArgentinaArmeniaArubaAustraliaAustriaAzerbaijanBahamas, TheBahrainBangladeshBarbadosBelarusBelgiumBelizeBeninBhutanBoliviaBosnia and HerzegovinaBotswanaBrazilBrunei DarussalamBulgariaBurkina FasoBurundiCabo VerdeCambodiaCameroonCanadaCaribbean small statesCentral African RepublicCentral Europe and the BalticsChadChannel IslandsChileChinaColombiaComorosCongo, Dem. Rep.Congo, Rep.Costa RicaCote d'IvoireCroatiaCubaCuracaoCyprusCzech RepublicDenmarkDjiboutiDominicaDominican RepublicEarly-demographic dividendEast Asia & PacificEast Asia & Pacific (excluding high income)East Asia & Pacific (IDA & IBRD countries)EcuadorEgypt, Arab Rep.El SalvadorEquatorial GuineaEritreaEstoniaEthiopiaEuro areaEurope & Central AsiaEurope & Central Asia (excluding high income)Europe & Central Asia (IDA & IBRD countries)European UnionFijiFinlandFragile and conflict affected situationsFranceFrench PolynesiaGabonGambia, TheGeorgiaGermanyGhanaGreeceGreenlandGrenadaGuamGuatemalaGuineaGuinea-BissauGuyanaHaitiHeavily indebted poor countries (HIPC)High incomeHondurasHong Kong SAR, ChinaHungaryIBRD onlyIcelandIDA & IBRD totalIDA blendIDA onlyIDA totalIndiaIndonesiaIran, Islamic Rep.IraqIrelandIsraelItalyJamaicaJapanJordanKazakhstanKenyaKiribatiKorea, Dem. People’s Rep.Korea, Rep.KuwaitKyrgyz RepublicLao PDRLate-demographic dividendLatin America & Caribbean Latin America & Caribbean (excluding high income)Latin America & the Caribbean (IDA & IBRD countries)LatviaLeast developed countries: UN classificationLebanonLesothoLiberiaLibyaLithuaniaLow & middle incomeLow incomeLower middle incomeLuxembourgMacao SAR, ChinaMacedonia, FYRMadagascarMalawiMalaysiaMaldivesMaliMaltaMarshall IslandsMauritaniaMauritiusMexicoMicronesia, Fed. Sts.Middle East & North AfricaMiddle East & North Africa (excluding high income)Middle East & North Africa (IDA & IBRD countries)Middle incomeMoldovaMongoliaMontenegroMoroccoMozambiqueMyanmarNamibiaNepalNetherlandsNew CaledoniaNew ZealandNicaraguaNigerNigeriaNorth AmericaNorwayOECD membersOmanOther small statesPacific island small statesPakistanPanamaPapua New GuineaParaguayPeruPhilippinesPolandPortugalPost-demographic dividendPre-demographic dividendPuerto RicoQatarRomaniaRussian FederationRwandaSamoaSao Tome and PrincipeSaudi ArabiaSenegalSerbiaSeychellesSierra LeoneSingaporeSlovak RepublicSloveniaSmall statesSolomon IslandsSomaliaSouth AfricaSouth AsiaSouth Asia (IDA & IBRD)South SudanSpainSri LankaSt. Kitts and NevisSt. LuciaSt. Vincent and the GrenadinesSub-Saharan Africa Sub-Saharan Africa (excluding high income)Sub-Saharan Africa (IDA & IBRD countries)SudanSurinameSwazilandSwedenSwitzerlandSyrian Arab RepublicTajikistanTanzaniaThailandTimor-LesteTogoTongaTrinidad and TobagoTunisiaTurkeyTurkmenistanUgandaUkraineUnited Arab EmiratesUnited KingdomUnited StatesUpper middle incomeUruguayUzbekistanVanuatuVenezuela, RBVietnamVirgin Islands (U.S.)West Bank and GazaWorldYemen, Rep.ZambiaZimbabwe línea de tiempo (timeline):
En esta escala de tiempo se presenta un gráfico de 1961 y 2015 de Ghana. Los datos de 1960 están ausentes. El número de observaciones reales por fecha: 55.
Fuente (nombre):
Indicadores del desarrollo mundial
Fuente (organización):
(1) United Nations Population Division. World Population Prospects. New York, United Nations, Department of Economic and Social Affairs (advanced Excel tables). Available at http://esa.un.org/wpp/unpp/panel_population.htm, (2) University of California, Berkeley, and Max Planck Institute for Demographic Research. Human Mortality Database. [ www.mortality.org or www.humanmortality.de].
Categorías:
Health, Gender
Se ha actualizado:
23 abr 2017 año
Los indicadores de los cambios de valor en los últimos años
Mínimo:
270.232
1 ene 2015 año
Máximo:
407.569
1 ene 1961 año
A la fecha de observación
Valor
Cambio absoluto
El cambio con respecto al valor anterior
1 ene 1961 año
407.569
+407.569
0.0%
1 ene 1962 año
403.381
-4.188
-1.03%
1 ene 1963 año
399.193
-4.188
-1.04%
1 ene 1964 año
396.084
-3.109
-0.78%
1 ene 1965 año
392.975
-3.109
-0.78%
1 ene 1966 año
389.866
-3.109
-0.79%
1 ene 1967 año
386.757
-3.109
-0.8%
1 ene 1968 año
383.648
-3.109
-0.8%
1 ene 1969 año
382.112
-1.536
-0.4%
1 ene 1970 año
380.576
-1.536
-0.4%
1 ene 1971 año
379.041
-1.535
-0.4%
1 ene 1972 año
377.505
-1.536
-0.41%
1 ene 1973 año
375.969
-1.536
-0.41%
1 ene 1974 año
372.822
-3.147
-0.84%
1 ene 1975 año
369.675
-3.147
-0.84%
1 ene 1976 año
366.529
-3.146
-0.85%
1 ene 1977 año
363.382
-3.147
-0.86%
1 ene 1978 año
360.235
-3.147
-0.87%
1 ene 1979 año
357.128
-3.107
-0.86%
1 ene 1980 año
354.021
-3.107
-0.87%
1 ene 1981 año
350.914
-3.107
-0.88%
1 ene 1982 año
347.807
-3.107
-0.89%
1 ene 1983 año
344.7
-3.107
-0.89%
1 ene 1984 año
339.725
-4.975
-1.44%
1 ene 1985 año
334.75
-4.975
-1.46%
1 ene 1986 año
329.775
-4.975
-1.49%
1 ene 1987 año
324.8
-4.975
-1.51%
1 ene 1988 año
319.825
-4.975
-1.53%
1 ene 1989 año
315.023
-4.802
-1.5%
1 ene 1990 año
310.22
-4.803
-1.52%
1 ene 1991 año
305.418
-4.802
-1.55%
1 ene 1992 año
300.616
-4.802
-1.57%
1 ene 1993 año
295.813
-4.803
-1.6%
1 ene 1994 año
300.117
+4.304
1.45%
1 ene 1995 año
304.421
+4.304
1.43%
1 ene 1996 año
308.725
+4.304
1.41%
1 ene 1997 año
313.029
+4.304
1.39%
1 ene 1998 año
317.334
+4.305
1.38%
1 ene 1999 año
317.91
+0.576
0.18%
1 ene 2000 año
318.487
+0.577
0.18%
1 ene 2001 año
319.064
+0.577
0.18%
1 ene 2002 año
319.641
+0.577
0.18%
1 ene 2003 año
320.218
+0.577
0.18%
1 ene 2004 año
312.927
-7.291
-2.28%
1 ene 2005 año
305.637
-7.29
-2.33%
1 ene 2006 año
298.347
-7.29
-2.39%
1 ene 2007 año
291.057
-7.29
-2.44%
1 ene 2008 año
283.767
-7.29
-2.5%
1 ene 2009 año
281.861
-1.906
-0.67%
1 ene 2010 año
279.956
-1.905
-0.68%
1 ene 2011 año
278.051
-1.905
-0.68%
1 ene 2012 año
276.145
-1.906
-0.69%
1 ene 2013 año
274.24
-1.905
-0.69%
1 ene 2014 año
272.236
-2.004
-0.73%
1 ene 2015 año
270.232
-2.004
-0.74%
Ranking de los países por los datos estadísticos actuales


Comentarios: