29
/es/
es
AIzaSyAYiBZKx7MnpbEhh9jyipgxe19OcubqV5w
April 1, 2024
253314
Sudan
SDN
true
2
1
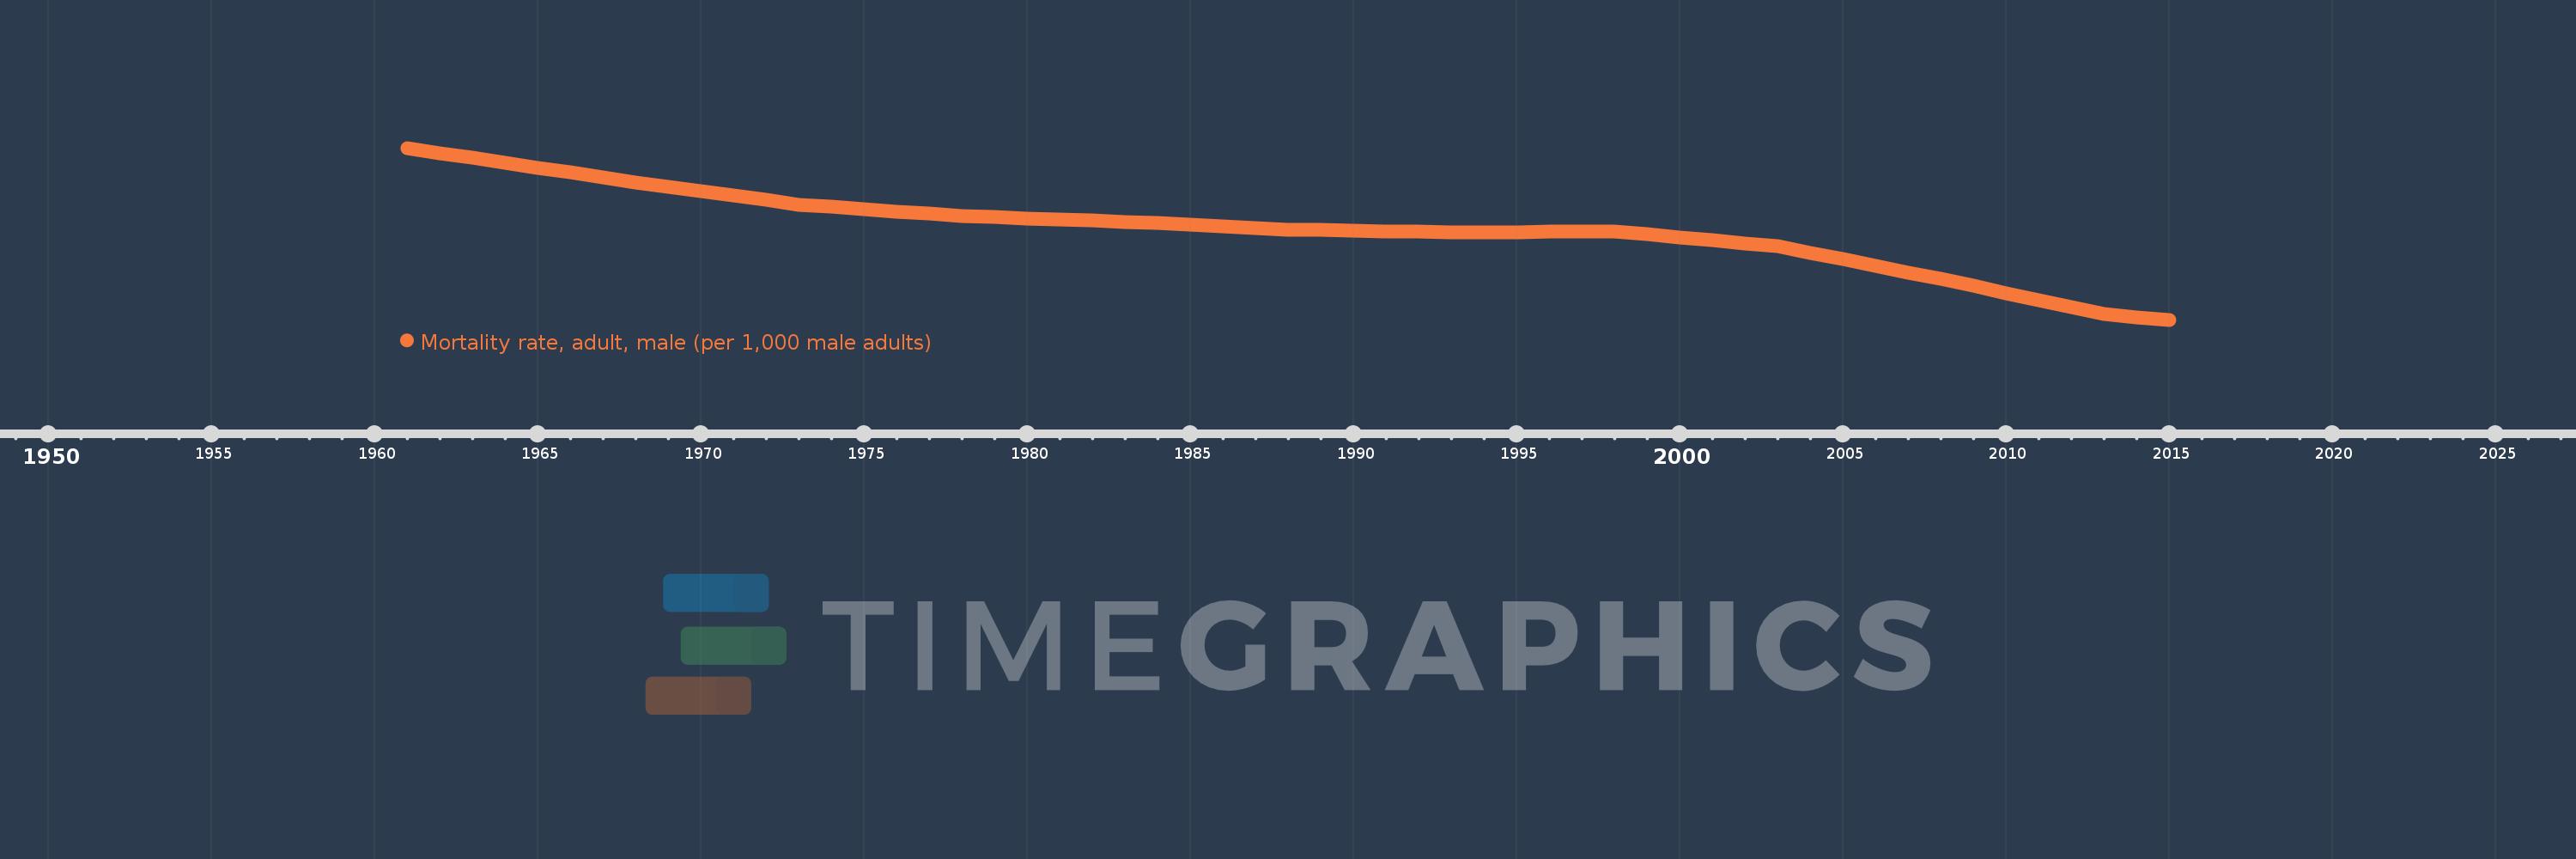
Mortality rate, adult, male (per 1,000 male adults)
2015,2014,2013,2012,2011,2010,2009,2008,2007,2006,2005,2004,2003,2002,2001,2000,1999,1998,1997,1996,1995,1994,1993,1992,1991,1990,1989,1988,1987,1986,1985,1984,1983,1982,1981,1980,1979,1978,1977,1976,1975,1974,1973,1972,1971,1970,1969,1968,1967,1966,1965,1964,1963,1962,1961
Estas estadísticas en otros países:
AfghanistanAlbaniaAlgeriaAngolaAntigua and BarbudaArab WorldArgentinaArmeniaArubaAustraliaAustriaAzerbaijanBahamas, TheBahrainBangladeshBarbadosBelarusBelgiumBelizeBeninBhutanBoliviaBosnia and HerzegovinaBotswanaBrazilBrunei DarussalamBulgariaBurkina FasoBurundiCabo VerdeCambodiaCameroonCanadaCaribbean small statesCentral African RepublicCentral Europe and the BalticsChadChannel IslandsChileChinaColombiaComorosCongo, Dem. Rep.Congo, Rep.Costa RicaCote d'IvoireCroatiaCubaCuracaoCyprusCzech RepublicDenmarkDjiboutiDominicaDominican RepublicEarly-demographic dividendEast Asia & PacificEast Asia & Pacific (excluding high income)East Asia & Pacific (IDA & IBRD countries)EcuadorEgypt, Arab Rep.El SalvadorEquatorial GuineaEritreaEstoniaEthiopiaEuro areaEurope & Central AsiaEurope & Central Asia (excluding high income)Europe & Central Asia (IDA & IBRD countries)European UnionFijiFinlandFragile and conflict affected situationsFranceFrench PolynesiaGabonGambia, TheGeorgiaGermanyGhanaGreeceGreenlandGrenadaGuamGuatemalaGuineaGuinea-BissauGuyanaHaitiHeavily indebted poor countries (HIPC)High incomeHondurasHong Kong SAR, ChinaHungaryIBRD onlyIcelandIDA & IBRD totalIDA blendIDA onlyIDA totalIndiaIndonesiaIran, Islamic Rep.IraqIrelandIsraelItalyJamaicaJapanJordanKazakhstanKenyaKiribatiKorea, Dem. People’s Rep.Korea, Rep.KuwaitKyrgyz RepublicLao PDRLate-demographic dividendLatin America & Caribbean Latin America & Caribbean (excluding high income)Latin America & the Caribbean (IDA & IBRD countries)LatviaLeast developed countries: UN classificationLebanonLesothoLiberiaLibyaLithuaniaLow & middle incomeLow incomeLower middle incomeLuxembourgMacao SAR, ChinaMacedonia, FYRMadagascarMalawiMalaysiaMaldivesMaliMaltaMarshall IslandsMauritaniaMauritiusMexicoMicronesia, Fed. Sts.Middle East & North AfricaMiddle East & North Africa (excluding high income)Middle East & North Africa (IDA & IBRD countries)Middle incomeMoldovaMongoliaMontenegroMoroccoMozambiqueMyanmarNamibiaNepalNetherlandsNew CaledoniaNew ZealandNicaraguaNigerNigeriaNorth AmericaNorwayOECD membersOmanOther small statesPacific island small statesPakistanPanamaPapua New GuineaParaguayPeruPhilippinesPolandPortugalPost-demographic dividendPre-demographic dividendPuerto RicoQatarRomaniaRussian FederationRwandaSamoaSao Tome and PrincipeSaudi ArabiaSenegalSerbiaSeychellesSierra LeoneSingaporeSlovak RepublicSloveniaSmall statesSolomon IslandsSomaliaSouth AfricaSouth AsiaSouth Asia (IDA & IBRD)South SudanSpainSri LankaSt. Kitts and NevisSt. LuciaSt. Vincent and the GrenadinesSub-Saharan Africa Sub-Saharan Africa (excluding high income)Sub-Saharan Africa (IDA & IBRD countries)SudanSurinameSwazilandSwedenSwitzerlandSyrian Arab RepublicTajikistanTanzaniaThailandTimor-LesteTogoTongaTrinidad and TobagoTunisiaTurkeyTurkmenistanUgandaUkraineUnited Arab EmiratesUnited KingdomUnited StatesUpper middle incomeUruguayUzbekistanVanuatuVenezuela, RBVietnamVirgin Islands (U.S.)West Bank and GazaWorldYemen, Rep.ZambiaZimbabwe línea de tiempo (timeline):
En esta escala de tiempo se presenta un gráfico de 1961 y 2015 de Sudan. Los datos de 1960 están ausentes. El número de observaciones reales por fecha: 55.
Fuente (nombre):
Indicadores del desarrollo mundial
Fuente (organización):
(1) United Nations Population Division. World Population Prospects. New York, United Nations, Department of Economic and Social Affairs (advanced Excel tables). Available at http://esa.un.org/wpp/unpp/panel_population.htm, (2) University of California, Berkeley, and Max Planck Institute for Demographic Research. Human Mortality Database. [ www.mortality.org or www.humanmortality.de].
Categorías:
Health, Gender
Se ha actualizado:
23 abr 2017 año
Los indicadores de los cambios de valor en los últimos años
Mínimo:
254.308
1 ene 2015 año
Máximo:
392.68
1 ene 1961 año
A la fecha de observación
Valor
Cambio absoluto
El cambio con respecto al valor anterior
1 ene 1961 año
392.68
+392.68
0.0%
1 ene 1962 año
388.652
-4.028
-1.03%
1 ene 1963 año
384.623
-4.029
-1.04%
1 ene 1964 año
380.686
-3.937
-1.02%
1 ene 1965 año
376.749
-3.937
-1.03%
1 ene 1966 año
372.813
-3.936
-1.04%
1 ene 1967 año
368.876
-3.937
-1.06%
1 ene 1968 año
364.939
-3.937
-1.07%
1 ene 1969 año
361.36
-3.579
-0.98%
1 ene 1970 año
357.78
-3.58
-0.99%
1 ene 1971 año
354.201
-3.579
-1.0%
1 ene 1972 año
350.622
-3.579
-1.01%
1 ene 1973 año
347.042
-3.58
-1.02%
1 ene 1974 año
345.215
-1.827
-0.53%
1 ene 1975 año
343.387
-1.828
-0.53%
1 ene 1976 año
341.559
-1.828
-0.53%
1 ene 1977 año
339.732
-1.827
-0.53%
1 ene 1978 año
337.904
-1.828
-0.54%
1 ene 1979 año
336.98
-0.924
-0.27%
1 ene 1980 año
336.056
-0.924
-0.27%
1 ene 1981 año
335.132
-0.924
-0.27%
1 ene 1982 año
334.208
-0.924
-0.28%
1 ene 1983 año
333.284
-0.924
-0.28%
1 ene 1984 año
332.046
-1.238
-0.37%
1 ene 1985 año
330.807
-1.239
-0.37%
1 ene 1986 año
329.568
-1.239
-0.37%
1 ene 1987 año
328.329
-1.239
-0.38%
1 ene 1988 año
327.09
-1.239
-0.38%
1 ene 1989 año
326.617
-0.473
-0.14%
1 ene 1990 año
326.145
-0.472
-0.14%
1 ene 1991 año
325.672
-0.473
-0.15%
1 ene 1992 año
325.199
-0.473
-0.15%
1 ene 1993 año
324.727
-0.472
-0.15%
1 ene 1994 año
324.837
+0.11
0.03%
1 ene 1995 año
324.947
+0.11
0.03%
1 ene 1996 año
325.057
+0.11
0.03%
1 ene 1997 año
325.167
+0.11
0.03%
1 ene 1998 año
325.277
+0.11
0.03%
1 ene 1999 año
322.947
-2.33
-0.72%
1 ene 2000 año
320.616
-2.331
-0.72%
1 ene 2001 año
318.286
-2.33
-0.73%
1 ene 2002 año
315.955
-2.331
-0.73%
1 ene 2003 año
313.625
-2.33
-0.74%
1 ene 2004 año
308.336
-5.289
-1.69%
1 ene 2005 año
303.046
-5.29
-1.72%
1 ene 2006 año
297.757
-5.289
-1.75%
1 ene 2007 año
292.468
-5.289
-1.78%
1 ene 2008 año
287.179
-5.289
-1.81%
1 ene 2009 año
281.478
-5.701
-1.99%
1 ene 2010 año
275.777
-5.701
-2.03%
1 ene 2011 año
270.076
-5.701
-2.07%
1 ene 2012 año
264.375
-5.701
-2.11%
1 ene 2013 año
258.674
-5.701
-2.16%
1 ene 2014 año
256.491
-2.183
-0.84%
1 ene 2015 año
254.308
-2.183
-0.85%
Ranking de los países por los datos estadísticos actuales


Comentarios: