29
/es/
es
AIzaSyAYiBZKx7MnpbEhh9jyipgxe19OcubqV5w
April 1, 2024
32848
Europe & Central Asia (IDA & IBRD countries)
TEC
false
2
1
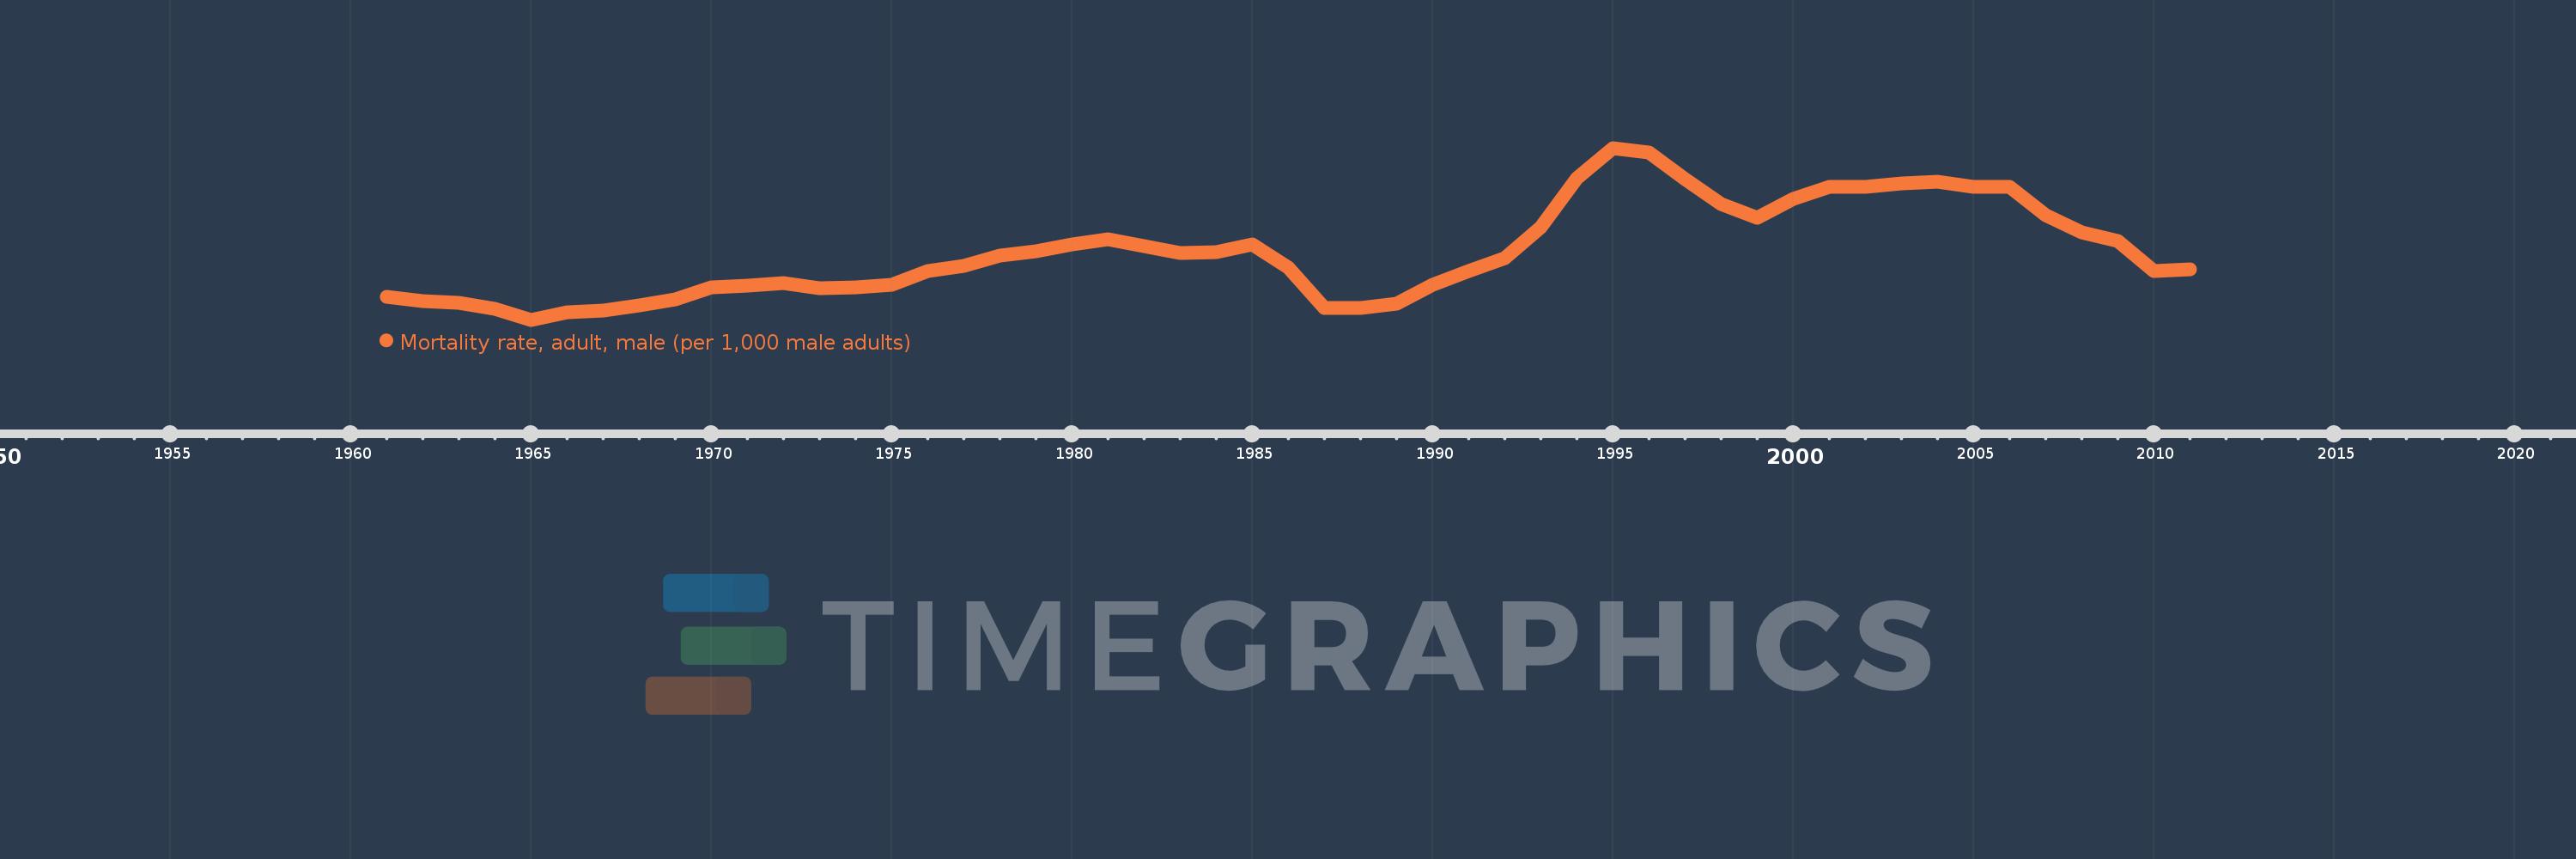
Mortality rate, adult, male (per 1,000 male adults)
2011,2010,2009,2008,2007,2006,2005,2004,2003,2002,2001,2000,1999,1998,1997,1996,1995,1994,1993,1992,1991,1990,1989,1988,1987,1986,1985,1984,1983,1982,1981,1980,1979,1978,1977,1976,1975,1974,1973,1972,1971,1970,1969,1968,1967,1966,1965,1964,1963,1962,1961
Estas estadísticas en otros países:
AfghanistanAlbaniaAlgeriaAngolaAntigua and BarbudaArab WorldArgentinaArmeniaArubaAustraliaAustriaAzerbaijanBahamas, TheBahrainBangladeshBarbadosBelarusBelgiumBelizeBeninBhutanBoliviaBosnia and HerzegovinaBotswanaBrazilBrunei DarussalamBulgariaBurkina FasoBurundiCabo VerdeCambodiaCameroonCanadaCaribbean small statesCentral African RepublicCentral Europe and the BalticsChadChannel IslandsChileChinaColombiaComorosCongo, Dem. Rep.Congo, Rep.Costa RicaCote d'IvoireCroatiaCubaCuracaoCyprusCzech RepublicDenmarkDjiboutiDominicaDominican RepublicEarly-demographic dividendEast Asia & PacificEast Asia & Pacific (excluding high income)East Asia & Pacific (IDA & IBRD countries)EcuadorEgypt, Arab Rep.El SalvadorEquatorial GuineaEritreaEstoniaEthiopiaEuro areaEurope & Central AsiaEurope & Central Asia (excluding high income)Europe & Central Asia (IDA & IBRD countries)European UnionFijiFinlandFragile and conflict affected situationsFranceFrench PolynesiaGabonGambia, TheGeorgiaGermanyGhanaGreeceGreenlandGrenadaGuamGuatemalaGuineaGuinea-BissauGuyanaHaitiHeavily indebted poor countries (HIPC)High incomeHondurasHong Kong SAR, ChinaHungaryIBRD onlyIcelandIDA & IBRD totalIDA blendIDA onlyIDA totalIndiaIndonesiaIran, Islamic Rep.IraqIrelandIsraelItalyJamaicaJapanJordanKazakhstanKenyaKiribatiKorea, Dem. People’s Rep.Korea, Rep.KuwaitKyrgyz RepublicLao PDRLate-demographic dividendLatin America & Caribbean Latin America & Caribbean (excluding high income)Latin America & the Caribbean (IDA & IBRD countries)LatviaLeast developed countries: UN classificationLebanonLesothoLiberiaLibyaLithuaniaLow & middle incomeLow incomeLower middle incomeLuxembourgMacao SAR, ChinaMacedonia, FYRMadagascarMalawiMalaysiaMaldivesMaliMaltaMarshall IslandsMauritaniaMauritiusMexicoMicronesia, Fed. Sts.Middle East & North AfricaMiddle East & North Africa (excluding high income)Middle East & North Africa (IDA & IBRD countries)Middle incomeMoldovaMongoliaMontenegroMoroccoMozambiqueMyanmarNamibiaNepalNetherlandsNew CaledoniaNew ZealandNicaraguaNigerNigeriaNorth AmericaNorwayOECD membersOmanOther small statesPacific island small statesPakistanPanamaPapua New GuineaParaguayPeruPhilippinesPolandPortugalPost-demographic dividendPre-demographic dividendPuerto RicoQatarRomaniaRussian FederationRwandaSamoaSao Tome and PrincipeSaudi ArabiaSenegalSerbiaSeychellesSierra LeoneSingaporeSlovak RepublicSloveniaSmall statesSolomon IslandsSomaliaSouth AfricaSouth AsiaSouth Asia (IDA & IBRD)South SudanSpainSri LankaSt. Kitts and NevisSt. LuciaSt. Vincent and the GrenadinesSub-Saharan Africa Sub-Saharan Africa (excluding high income)Sub-Saharan Africa (IDA & IBRD countries)SudanSurinameSwazilandSwedenSwitzerlandSyrian Arab RepublicTajikistanTanzaniaThailandTimor-LesteTogoTongaTrinidad and TobagoTunisiaTurkeyTurkmenistanUgandaUkraineUnited Arab EmiratesUnited KingdomUnited StatesUpper middle incomeUruguayUzbekistanVanuatuVenezuela, RBVietnamVirgin Islands (U.S.)West Bank and GazaWorldYemen, Rep.ZambiaZimbabwe línea de tiempo (timeline):
En esta escala de tiempo se presenta un gráfico de 1961 y 2011 de Europe & Central Asia (IDA & IBRD countries). Los datos de 1960 están ausentes. El número de observaciones reales por fecha: 51.
Fuente (nombre):
Indicadores del desarrollo mundial
Fuente (organización):
(1) United Nations Population Division. World Population Prospects. New York, United Nations, Department of Economic and Social Affairs (advanced Excel tables). Available at http://esa.un.org/wpp/unpp/panel_population.htm, (2) University of California, Berkeley, and Max Planck Institute for Demographic Research. Human Mortality Database. [ www.mortality.org or www.humanmortality.de].
Categorías:
Health, Gender
Se ha actualizado:
23 abr 2017 año
Los indicadores de los cambios de valor en los últimos años
Mínimo:
246.977
1 ene 1965 año
Máximo:
347.773
1 ene 1995 año
A la fecha de observación
Valor
Cambio absoluto
El cambio con respecto al valor anterior
1 ene 1961 año
260.37
+260.37
0.0%
1 ene 1962 año
258.143
-2.227
-0.86%
1 ene 1963 año
256.838
-1.306
-0.51%
1 ene 1964 año
253.17
-3.668
-1.43%
1 ene 1965 año
246.977
-6.193
-2.45%
1 ene 1966 año
251.155
+4.178
1.69%
1 ene 1967 año
252.134
+0.98
0.39%
1 ene 1968 año
255.537
+3.402
1.35%
1 ene 1969 año
258.723
+3.187
1.25%
1 ene 1970 año
266.02
+7.297
2.82%
1 ene 1971 año
267.091
+1.071
0.4%
1 ene 1972 año
268.349
+1.258
0.47%
1 ene 1973 año
265.615
-2.735
-1.02%
1 ene 1974 año
265.829
+0.215
0.08%
1 ene 1975 año
267.479
+1.65
0.62%
1 ene 1976 año
275.565
+8.086
3.02%
1 ene 1977 año
278.533
+2.968
1.08%
1 ene 1978 año
284.673
+6.141
2.2%
1 ene 1979 año
287.356
+2.682
0.94%
1 ene 1980 año
291.333
+3.977
1.38%
1 ene 1981 año
294.368
+3.035
1.04%
1 ene 1982 año
290.095
-4.273
-1.45%
1 ene 1983 año
286.009
-4.086
-1.41%
1 ene 1984 año
286.52
+0.511
0.18%
1 ene 1985 año
291.121
+4.6
1.61%
1 ene 1986 año
277.78
-13.341
-4.58%
1 ene 1987 año
253.937
-23.843
-8.58%
1 ene 1988 año
253.693
-0.243
-0.1%
1 ene 1989 año
256.542
+2.849
1.12%
1 ene 1990 año
267.386
+10.843
4.23%
1 ene 1991 año
275.502
+8.117
3.04%
1 ene 1992 año
283.075
+7.573
2.75%
1 ene 1993 año
301.384
+18.308
6.47%
1 ene 1994 año
330.105
+28.722
9.53%
1 ene 1995 año
347.773
+17.668
5.35%
1 ene 1996 año
345.022
-2.751
-0.79%
1 ene 1997 año
329.373
-15.649
-4.54%
1 ene 1998 año
314.722
-14.651
-4.45%
1 ene 1999 año
306.963
-7.758
-2.47%
1 ene 2000 año
317.793
+10.83
3.53%
1 ene 2001 año
324.865
+7.072
2.23%
1 ene 2002 año
325.121
+0.255
0.08%
1 ene 2003 año
327.112
+1.991
0.61%
1 ene 2004 año
328.004
+0.892
0.27%
1 ene 2005 año
325.014
-2.99
-0.91%
1 ene 2006 año
325.056
+0.042
0.01%
1 ene 2007 año
308.221
-16.835
-5.18%
1 ene 2008 año
298.143
-10.079
-3.27%
1 ene 2009 año
292.988
-5.154
-1.73%
1 ene 2010 año
275.711
-17.278
-5.9%
1 ene 2011 año
276.514
+0.803
0.29%
Ranking de los países por los datos estadísticos actuales


Comentarios: