29
/es/
es
AIzaSyAYiBZKx7MnpbEhh9jyipgxe19OcubqV5w
April 1, 2024
254381
Suriname
SUR
true
2
1
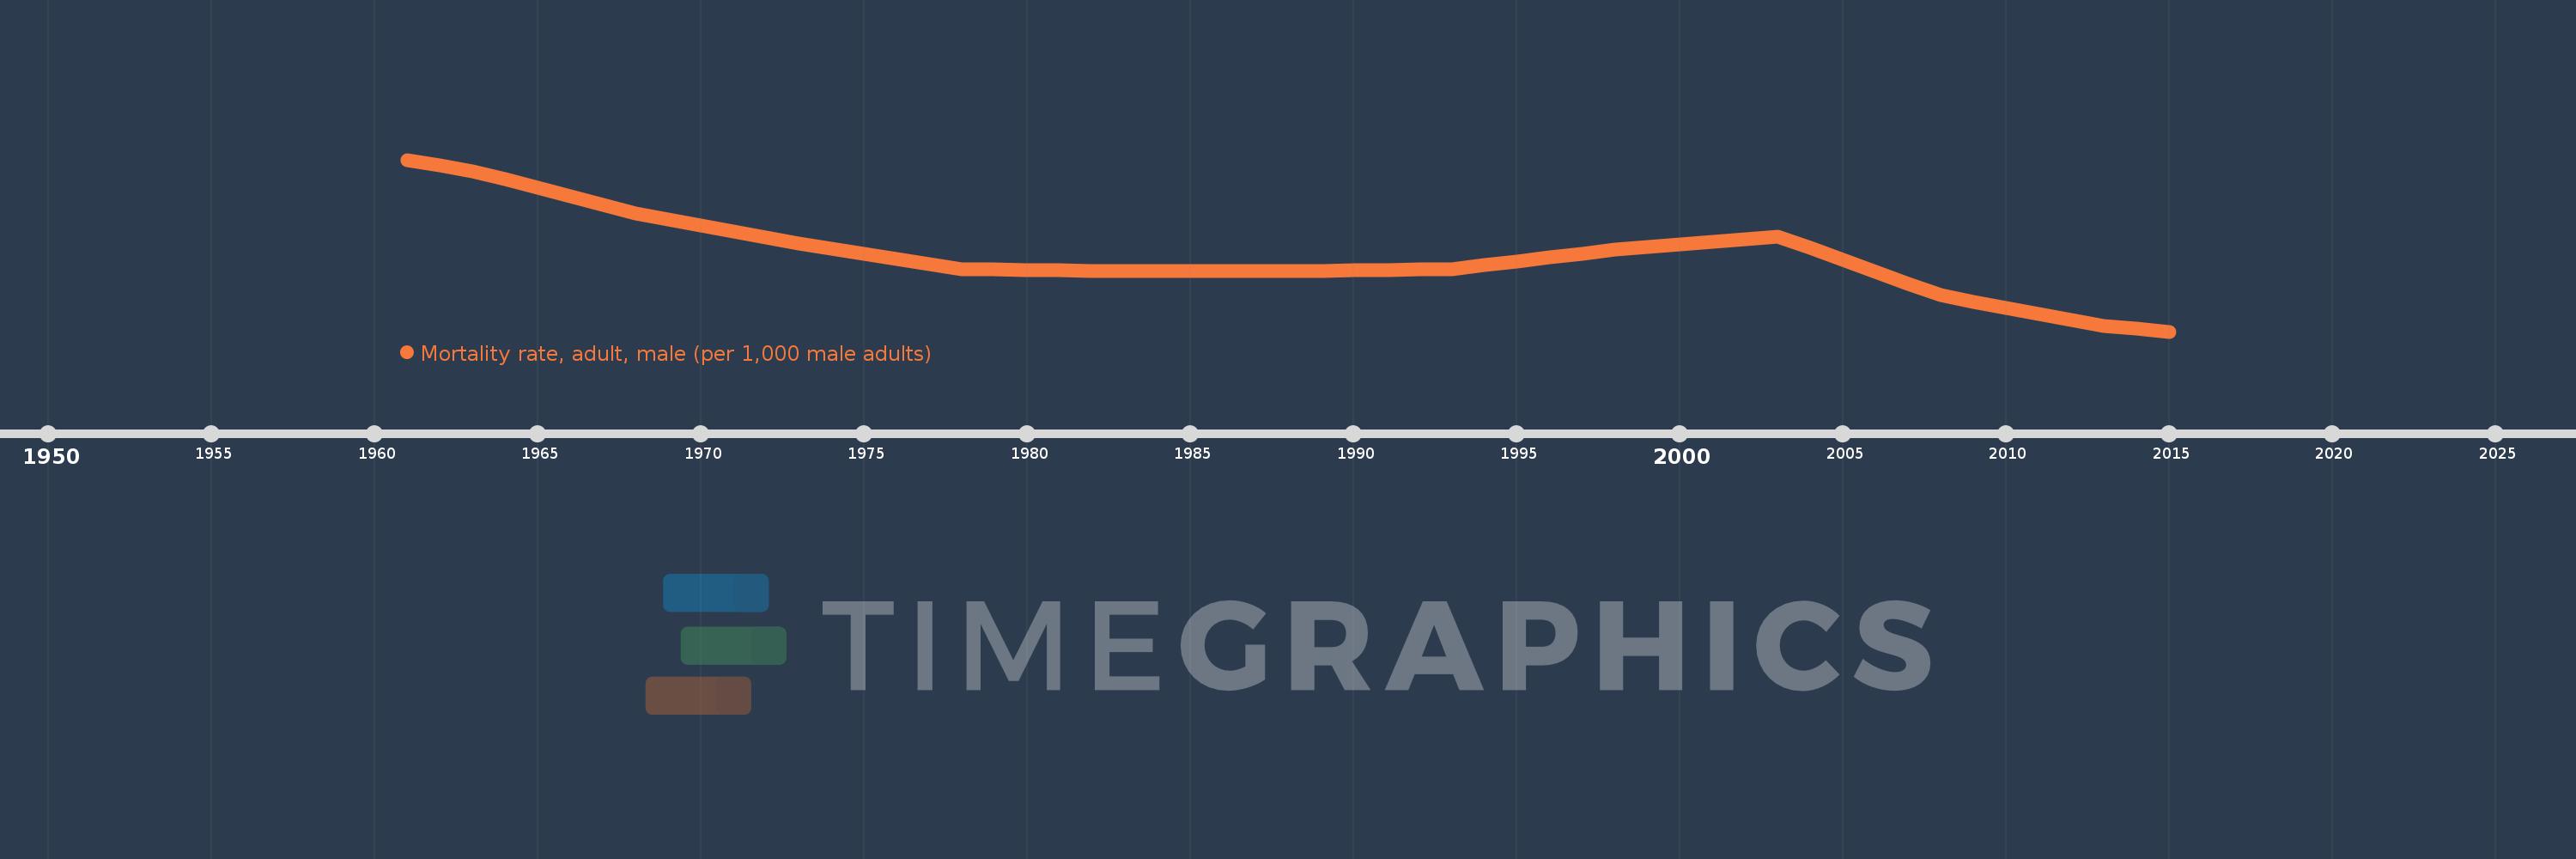
Mortality rate, adult, male (per 1,000 male adults)
2015,2014,2013,2012,2011,2010,2009,2008,2007,2006,2005,2004,2003,2002,2001,2000,1999,1998,1997,1996,1995,1994,1993,1992,1991,1990,1989,1988,1987,1986,1985,1984,1983,1982,1981,1980,1979,1978,1977,1976,1975,1974,1973,1972,1971,1970,1969,1968,1967,1966,1965,1964,1963,1962,1961
Estas estadísticas en otros países:
AfghanistanAlbaniaAlgeriaAngolaAntigua and BarbudaArab WorldArgentinaArmeniaArubaAustraliaAustriaAzerbaijanBahamas, TheBahrainBangladeshBarbadosBelarusBelgiumBelizeBeninBhutanBoliviaBosnia and HerzegovinaBotswanaBrazilBrunei DarussalamBulgariaBurkina FasoBurundiCabo VerdeCambodiaCameroonCanadaCaribbean small statesCentral African RepublicCentral Europe and the BalticsChadChannel IslandsChileChinaColombiaComorosCongo, Dem. Rep.Congo, Rep.Costa RicaCote d'IvoireCroatiaCubaCuracaoCyprusCzech RepublicDenmarkDjiboutiDominicaDominican RepublicEarly-demographic dividendEast Asia & PacificEast Asia & Pacific (excluding high income)East Asia & Pacific (IDA & IBRD countries)EcuadorEgypt, Arab Rep.El SalvadorEquatorial GuineaEritreaEstoniaEthiopiaEuro areaEurope & Central AsiaEurope & Central Asia (excluding high income)Europe & Central Asia (IDA & IBRD countries)European UnionFijiFinlandFragile and conflict affected situationsFranceFrench PolynesiaGabonGambia, TheGeorgiaGermanyGhanaGreeceGreenlandGrenadaGuamGuatemalaGuineaGuinea-BissauGuyanaHaitiHeavily indebted poor countries (HIPC)High incomeHondurasHong Kong SAR, ChinaHungaryIBRD onlyIcelandIDA & IBRD totalIDA blendIDA onlyIDA totalIndiaIndonesiaIran, Islamic Rep.IraqIrelandIsraelItalyJamaicaJapanJordanKazakhstanKenyaKiribatiKorea, Dem. People’s Rep.Korea, Rep.KuwaitKyrgyz RepublicLao PDRLate-demographic dividendLatin America & Caribbean Latin America & Caribbean (excluding high income)Latin America & the Caribbean (IDA & IBRD countries)LatviaLeast developed countries: UN classificationLebanonLesothoLiberiaLibyaLithuaniaLow & middle incomeLow incomeLower middle incomeLuxembourgMacao SAR, ChinaMacedonia, FYRMadagascarMalawiMalaysiaMaldivesMaliMaltaMarshall IslandsMauritaniaMauritiusMexicoMicronesia, Fed. Sts.Middle East & North AfricaMiddle East & North Africa (excluding high income)Middle East & North Africa (IDA & IBRD countries)Middle incomeMoldovaMongoliaMontenegroMoroccoMozambiqueMyanmarNamibiaNepalNetherlandsNew CaledoniaNew ZealandNicaraguaNigerNigeriaNorth AmericaNorwayOECD membersOmanOther small statesPacific island small statesPakistanPanamaPapua New GuineaParaguayPeruPhilippinesPolandPortugalPost-demographic dividendPre-demographic dividendPuerto RicoQatarRomaniaRussian FederationRwandaSamoaSao Tome and PrincipeSaudi ArabiaSenegalSerbiaSeychellesSierra LeoneSingaporeSlovak RepublicSloveniaSmall statesSolomon IslandsSomaliaSouth AfricaSouth AsiaSouth Asia (IDA & IBRD)South SudanSpainSri LankaSt. Kitts and NevisSt. LuciaSt. Vincent and the GrenadinesSub-Saharan Africa Sub-Saharan Africa (excluding high income)Sub-Saharan Africa (IDA & IBRD countries)SudanSurinameSwazilandSwedenSwitzerlandSyrian Arab RepublicTajikistanTanzaniaThailandTimor-LesteTogoTongaTrinidad and TobagoTunisiaTurkeyTurkmenistanUgandaUkraineUnited Arab EmiratesUnited KingdomUnited StatesUpper middle incomeUruguayUzbekistanVanuatuVenezuela, RBVietnamVirgin Islands (U.S.)West Bank and GazaWorldYemen, Rep.ZambiaZimbabwe línea de tiempo (timeline):
En esta escala de tiempo se presenta un gráfico de 1961 y 2015 de Suriname. Los datos de 1960 están ausentes. El número de observaciones reales por fecha: 55.
Fuente (nombre):
Indicadores del desarrollo mundial
Fuente (organización):
(1) United Nations Population Division. World Population Prospects. New York, United Nations, Department of Economic and Social Affairs (advanced Excel tables). Available at http://esa.un.org/wpp/unpp/panel_population.htm, (2) University of California, Berkeley, and Max Planck Institute for Demographic Research. Human Mortality Database. [ www.mortality.org or www.humanmortality.de].
Categorías:
Health, Gender
Se ha actualizado:
23 abr 2017 año
Los indicadores de los cambios de valor en los últimos años
Mínimo:
222.196
1 ene 2015 año
Máximo:
307.61
1 ene 1961 año
A la fecha de observación
Valor
Cambio absoluto
El cambio con respecto al valor anterior
1 ene 1961 año
307.61
+307.61
0.0%
1 ene 1962 año
304.823
-2.787
-0.91%
1 ene 1963 año
302.035
-2.788
-0.91%
1 ene 1964 año
297.825
-4.21
-1.39%
1 ene 1965 año
293.616
-4.209
-1.41%
1 ene 1966 año
289.406
-4.21
-1.43%
1 ene 1967 año
285.196
-4.21
-1.45%
1 ene 1968 año
280.986
-4.21
-1.48%
1 ene 1969 año
278.003
-2.983
-1.06%
1 ene 1970 año
275.02
-2.983
-1.07%
1 ene 1971 año
272.037
-2.983
-1.08%
1 ene 1972 año
269.054
-2.983
-1.1%
1 ene 1973 año
266.071
-2.983
-1.11%
1 ene 1974 año
263.494
-2.577
-0.97%
1 ene 1975 año
260.916
-2.578
-0.98%
1 ene 1976 año
258.339
-2.577
-0.99%
1 ene 1977 año
255.762
-2.577
-1.0%
1 ene 1978 año
253.184
-2.578
-1.01%
1 ene 1979 año
252.977
-0.207
-0.08%
1 ene 1980 año
252.769
-0.208
-0.08%
1 ene 1981 año
252.561
-0.208
-0.08%
1 ene 1982 año
252.354
-0.207
-0.08%
1 ene 1983 año
252.146
-0.208
-0.08%
1 ene 1984 año
252.157
+0.011
0.0%
1 ene 1985 año
252.167
+0.01
0.0%
1 ene 1986 año
252.177
+0.01
0.0%
1 ene 1987 año
252.188
+0.011
0.0%
1 ene 1988 año
252.198
+0.01
0.0%
1 ene 1989 año
252.404
+0.206
0.08%
1 ene 1990 año
252.611
+0.207
0.08%
1 ene 1991 año
252.817
+0.206
0.08%
1 ene 1992 año
253.023
+0.206
0.08%
1 ene 1993 año
253.229
+0.206
0.08%
1 ene 1994 año
255.166
+1.937
0.76%
1 ene 1995 año
257.104
+1.938
0.76%
1 ene 1996 año
259.042
+1.938
0.75%
1 ene 1997 año
260.979
+1.937
0.75%
1 ene 1998 año
262.917
+1.938
0.74%
1 ene 1999 año
264.249
+1.332
0.51%
1 ene 2000 año
265.581
+1.332
0.5%
1 ene 2001 año
266.913
+1.332
0.5%
1 ene 2002 año
268.246
+1.333
0.5%
1 ene 2003 año
269.578
+1.332
0.5%
1 ene 2004 año
263.69
-5.888
-2.18%
1 ene 2005 año
257.802
-5.888
-2.23%
1 ene 2006 año
251.914
-5.888
-2.28%
1 ene 2007 año
246.027
-5.887
-2.34%
1 ene 2008 año
240.139
-5.888
-2.39%
1 ene 2009 año
237.099
-3.04
-1.27%
1 ene 2010 año
234.059
-3.04
-1.28%
1 ene 2011 año
231.019
-3.04
-1.3%
1 ene 2012 año
227.979
-3.04
-1.32%
1 ene 2013 año
224.939
-3.04
-1.33%
1 ene 2014 año
223.568
-1.371
-0.61%
1 ene 2015 año
222.196
-1.372
-0.61%
Ranking de los países por los datos estadísticos actuales


Comentarios: