29
/es/
es
AIzaSyAYiBZKx7MnpbEhh9jyipgxe19OcubqV5w
April 1, 2024
26751
Early-demographic dividend
EAR
false
2
1
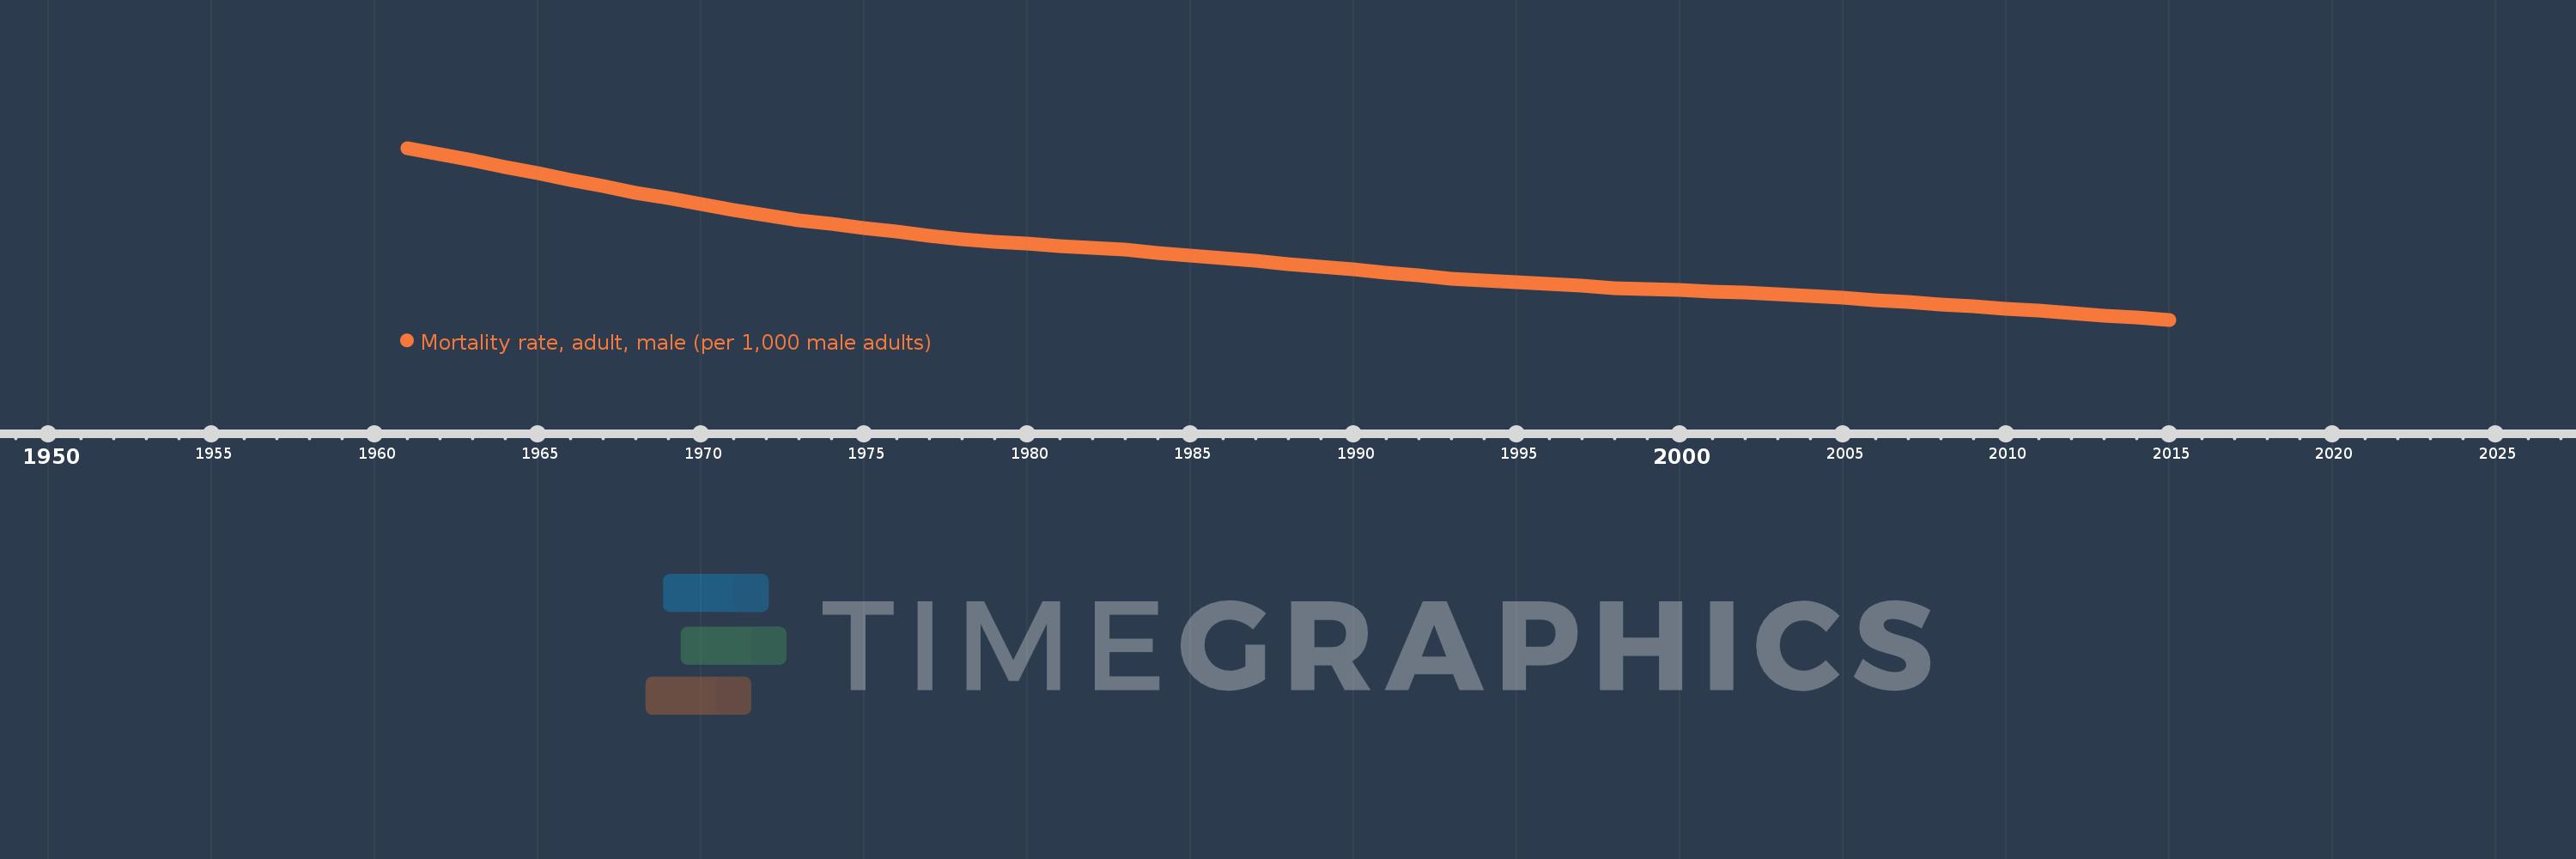
Mortality rate, adult, male (per 1,000 male adults)
2015,2014,2013,2012,2011,2010,2009,2008,2007,2006,2005,2004,2003,2002,2001,2000,1999,1998,1997,1996,1995,1994,1993,1992,1991,1990,1989,1988,1987,1986,1985,1984,1983,1982,1981,1980,1979,1978,1977,1976,1975,1974,1973,1972,1971,1970,1969,1968,1967,1966,1965,1964,1963,1962,1961
Estas estadísticas en otros países:
AfghanistanAlbaniaAlgeriaAngolaAntigua and BarbudaArab WorldArgentinaArmeniaArubaAustraliaAustriaAzerbaijanBahamas, TheBahrainBangladeshBarbadosBelarusBelgiumBelizeBeninBhutanBoliviaBosnia and HerzegovinaBotswanaBrazilBrunei DarussalamBulgariaBurkina FasoBurundiCabo VerdeCambodiaCameroonCanadaCaribbean small statesCentral African RepublicCentral Europe and the BalticsChadChannel IslandsChileChinaColombiaComorosCongo, Dem. Rep.Congo, Rep.Costa RicaCote d'IvoireCroatiaCubaCuracaoCyprusCzech RepublicDenmarkDjiboutiDominicaDominican RepublicEarly-demographic dividendEast Asia & PacificEast Asia & Pacific (excluding high income)East Asia & Pacific (IDA & IBRD countries)EcuadorEgypt, Arab Rep.El SalvadorEquatorial GuineaEritreaEstoniaEthiopiaEuro areaEurope & Central AsiaEurope & Central Asia (excluding high income)Europe & Central Asia (IDA & IBRD countries)European UnionFijiFinlandFragile and conflict affected situationsFranceFrench PolynesiaGabonGambia, TheGeorgiaGermanyGhanaGreeceGreenlandGrenadaGuamGuatemalaGuineaGuinea-BissauGuyanaHaitiHeavily indebted poor countries (HIPC)High incomeHondurasHong Kong SAR, ChinaHungaryIBRD onlyIcelandIDA & IBRD totalIDA blendIDA onlyIDA totalIndiaIndonesiaIran, Islamic Rep.IraqIrelandIsraelItalyJamaicaJapanJordanKazakhstanKenyaKiribatiKorea, Dem. People’s Rep.Korea, Rep.KuwaitKyrgyz RepublicLao PDRLate-demographic dividendLatin America & Caribbean Latin America & Caribbean (excluding high income)Latin America & the Caribbean (IDA & IBRD countries)LatviaLeast developed countries: UN classificationLebanonLesothoLiberiaLibyaLithuaniaLow & middle incomeLow incomeLower middle incomeLuxembourgMacao SAR, ChinaMacedonia, FYRMadagascarMalawiMalaysiaMaldivesMaliMaltaMarshall IslandsMauritaniaMauritiusMexicoMicronesia, Fed. Sts.Middle East & North AfricaMiddle East & North Africa (excluding high income)Middle East & North Africa (IDA & IBRD countries)Middle incomeMoldovaMongoliaMontenegroMoroccoMozambiqueMyanmarNamibiaNepalNetherlandsNew CaledoniaNew ZealandNicaraguaNigerNigeriaNorth AmericaNorwayOECD membersOmanOther small statesPacific island small statesPakistanPanamaPapua New GuineaParaguayPeruPhilippinesPolandPortugalPost-demographic dividendPre-demographic dividendPuerto RicoQatarRomaniaRussian FederationRwandaSamoaSao Tome and PrincipeSaudi ArabiaSenegalSerbiaSeychellesSierra LeoneSingaporeSlovak RepublicSloveniaSmall statesSolomon IslandsSomaliaSouth AfricaSouth AsiaSouth Asia (IDA & IBRD)South SudanSpainSri LankaSt. Kitts and NevisSt. LuciaSt. Vincent and the GrenadinesSub-Saharan Africa Sub-Saharan Africa (excluding high income)Sub-Saharan Africa (IDA & IBRD countries)SudanSurinameSwazilandSwedenSwitzerlandSyrian Arab RepublicTajikistanTanzaniaThailandTimor-LesteTogoTongaTrinidad and TobagoTunisiaTurkeyTurkmenistanUgandaUkraineUnited Arab EmiratesUnited KingdomUnited StatesUpper middle incomeUruguayUzbekistanVanuatuVenezuela, RBVietnamVirgin Islands (U.S.)West Bank and GazaWorldYemen, Rep.ZambiaZimbabwe línea de tiempo (timeline):
En esta escala de tiempo se presenta un gráfico de 1961 y 2015 de Early-demographic dividend. Los datos de 1960 están ausentes. El número de observaciones reales por fecha: 55.
Fuente (nombre):
Indicadores del desarrollo mundial
Fuente (organización):
(1) United Nations Population Division. World Population Prospects. New York, United Nations, Department of Economic and Social Affairs (advanced Excel tables). Available at http://esa.un.org/wpp/unpp/panel_population.htm, (2) University of California, Berkeley, and Max Planck Institute for Demographic Research. Human Mortality Database. [ www.mortality.org or www.humanmortality.de].
Categorías:
Health, Gender
Se ha actualizado:
23 abr 2017 año
Los indicadores de los cambios de valor en los últimos años
Mínimo:
206.426
1 ene 2015 año
Máximo:
413.393
1 ene 1961 año
A la fecha de observación
Valor
Cambio absoluto
El cambio con respecto al valor anterior
1 ene 1961 año
413.393
+413.393
0.0%
1 ene 1962 año
406.302
-7.091
-1.72%
1 ene 1963 año
398.552
-7.75
-1.91%
1 ene 1964 año
390.662
-7.89
-1.98%
1 ene 1965 año
382.842
-7.821
-2.0%
1 ene 1966 año
375.101
-7.74
-2.02%
1 ene 1967 año
367.354
-7.747
-2.07%
1 ene 1968 año
359.672
-7.682
-2.09%
1 ene 1969 año
352.966
-6.705
-1.86%
1 ene 1970 año
346.27
-6.696
-1.9%
1 ene 1971 año
339.087
-7.183
-2.07%
1 ene 1972 año
332.877
-6.21
-1.83%
1 ene 1973 año
326.194
-6.683
-2.01%
1 ene 1974 año
321.687
-4.508
-1.38%
1 ene 1975 año
317.153
-4.534
-1.41%
1 ene 1976 año
312.576
-4.577
-1.44%
1 ene 1977 año
307.881
-4.695
-1.5%
1 ene 1978 año
303.113
-4.769
-1.55%
1 ene 1979 año
300.533
-2.58
-0.85%
1 ene 1980 año
298.022
-2.51
-0.84%
1 ene 1981 año
295.194
-2.828
-0.95%
1 ene 1982 año
293.218
-1.976
-0.67%
1 ene 1983 año
290.864
-2.354
-0.8%
1 ene 1984 año
287.115
-3.749
-1.29%
1 ene 1985 año
283.759
-3.357
-1.17%
1 ene 1986 año
280.408
-3.35
-1.18%
1 ene 1987 año
277.036
-3.373
-1.2%
1 ene 1988 año
273.671
-3.365
-1.21%
1 ene 1989 año
270.194
-3.477
-1.27%
1 ene 1990 año
266.688
-3.506
-1.3%
1 ene 1991 año
263.11
-3.578
-1.34%
1 ene 1992 año
259.574
-3.536
-1.34%
1 ene 1993 año
256.026
-3.548
-1.37%
1 ene 1994 año
253.721
-2.305
-0.9%
1 ene 1995 año
251.471
-2.25
-0.89%
1 ene 1996 año
249.261
-2.211
-0.88%
1 ene 1997 año
246.999
-2.262
-0.91%
1 ene 1998 año
244.769
-2.23
-0.9%
1 ene 1999 año
243.386
-1.382
-0.56%
1 ene 2000 año
241.974
-1.412
-0.58%
1 ene 2001 año
240.584
-1.391
-0.57%
1 ene 2002 año
239.139
-1.445
-0.6%
1 ene 2003 año
237.675
-1.464
-0.61%
1 ene 2004 año
235.12
-2.554
-1.07%
1 ene 2005 año
232.582
-2.538
-1.08%
1 ene 2006 año
230.052
-2.53
-1.09%
1 ene 2007 año
227.553
-2.499
-1.09%
1 ene 2008 año
225.048
-2.505
-1.1%
1 ene 2009 año
222.292
-2.757
-1.22%
1 ene 2010 año
219.555
-2.736
-1.23%
1 ene 2011 año
217.21
-2.345
-1.07%
1 ene 2012 año
214.476
-2.735
-1.26%
1 ene 2013 año
211.733
-2.743
-1.28%
1 ene 2014 año
209.077
-2.656
-1.25%
1 ene 2015 año
206.426
-2.65
-1.27%
Ranking de los países por los datos estadísticos actuales


Comentarios: