29
/es/
es
AIzaSyAYiBZKx7MnpbEhh9jyipgxe19OcubqV5w
April 1, 2024
196816
Micronesia, Fed. Sts.
FSM
true
2
1
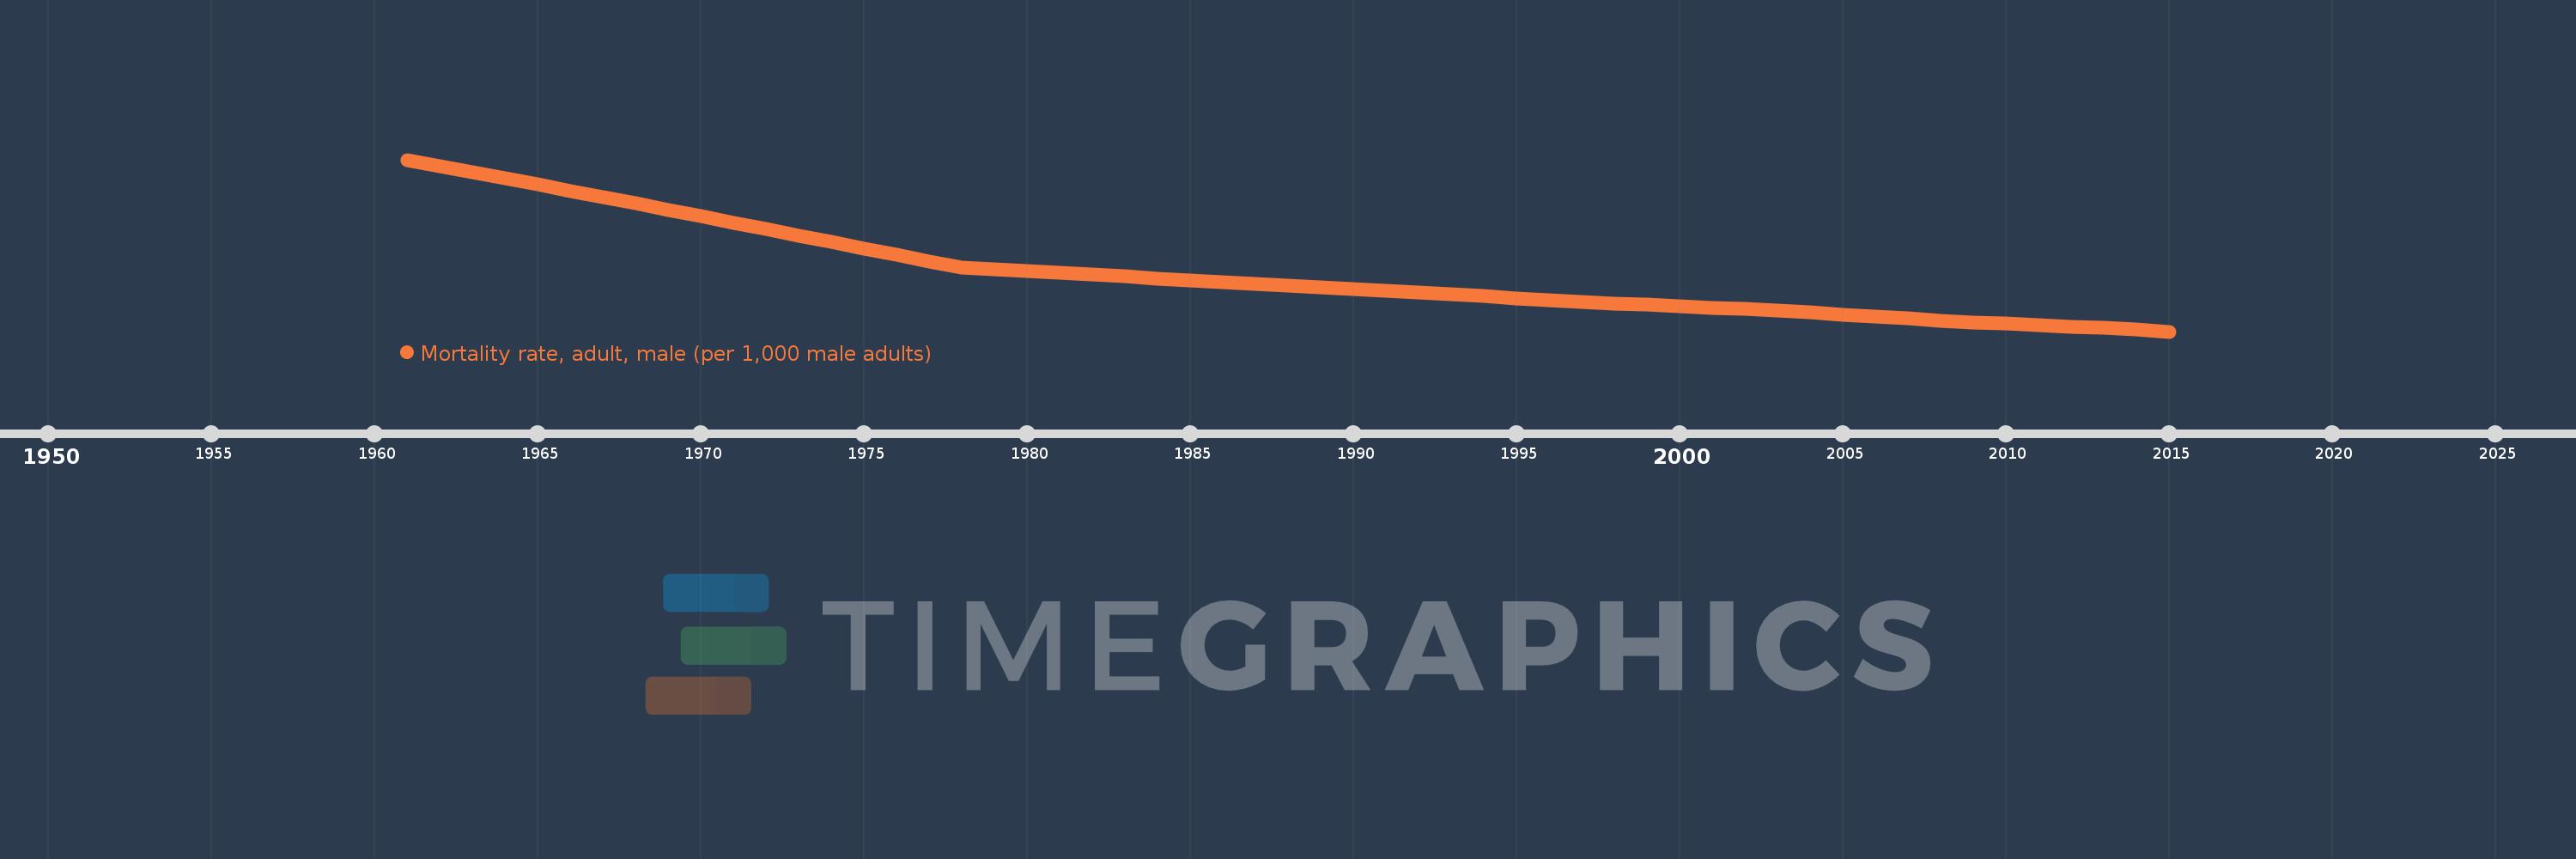
Mortality rate, adult, male (per 1,000 male adults)
2015,2014,2013,2012,2011,2010,2009,2008,2007,2006,2005,2004,2003,2002,2001,2000,1999,1998,1997,1996,1995,1994,1993,1992,1991,1990,1989,1988,1987,1986,1985,1984,1983,1982,1981,1980,1979,1978,1977,1976,1975,1974,1973,1972,1971,1970,1969,1968,1967,1966,1965,1964,1963,1962,1961
Estas estadísticas en otros países:
AfghanistanAlbaniaAlgeriaAngolaAntigua and BarbudaArab WorldArgentinaArmeniaArubaAustraliaAustriaAzerbaijanBahamas, TheBahrainBangladeshBarbadosBelarusBelgiumBelizeBeninBhutanBoliviaBosnia and HerzegovinaBotswanaBrazilBrunei DarussalamBulgariaBurkina FasoBurundiCabo VerdeCambodiaCameroonCanadaCaribbean small statesCentral African RepublicCentral Europe and the BalticsChadChannel IslandsChileChinaColombiaComorosCongo, Dem. Rep.Congo, Rep.Costa RicaCote d'IvoireCroatiaCubaCuracaoCyprusCzech RepublicDenmarkDjiboutiDominicaDominican RepublicEarly-demographic dividendEast Asia & PacificEast Asia & Pacific (excluding high income)East Asia & Pacific (IDA & IBRD countries)EcuadorEgypt, Arab Rep.El SalvadorEquatorial GuineaEritreaEstoniaEthiopiaEuro areaEurope & Central AsiaEurope & Central Asia (excluding high income)Europe & Central Asia (IDA & IBRD countries)European UnionFijiFinlandFragile and conflict affected situationsFranceFrench PolynesiaGabonGambia, TheGeorgiaGermanyGhanaGreeceGreenlandGrenadaGuamGuatemalaGuineaGuinea-BissauGuyanaHaitiHeavily indebted poor countries (HIPC)High incomeHondurasHong Kong SAR, ChinaHungaryIBRD onlyIcelandIDA & IBRD totalIDA blendIDA onlyIDA totalIndiaIndonesiaIran, Islamic Rep.IraqIrelandIsraelItalyJamaicaJapanJordanKazakhstanKenyaKiribatiKorea, Dem. People’s Rep.Korea, Rep.KuwaitKyrgyz RepublicLao PDRLate-demographic dividendLatin America & Caribbean Latin America & Caribbean (excluding high income)Latin America & the Caribbean (IDA & IBRD countries)LatviaLeast developed countries: UN classificationLebanonLesothoLiberiaLibyaLithuaniaLow & middle incomeLow incomeLower middle incomeLuxembourgMacao SAR, ChinaMacedonia, FYRMadagascarMalawiMalaysiaMaldivesMaliMaltaMarshall IslandsMauritaniaMauritiusMexicoMicronesia, Fed. Sts.Middle East & North AfricaMiddle East & North Africa (excluding high income)Middle East & North Africa (IDA & IBRD countries)Middle incomeMoldovaMongoliaMontenegroMoroccoMozambiqueMyanmarNamibiaNepalNetherlandsNew CaledoniaNew ZealandNicaraguaNigerNigeriaNorth AmericaNorwayOECD membersOmanOther small statesPacific island small statesPakistanPanamaPapua New GuineaParaguayPeruPhilippinesPolandPortugalPost-demographic dividendPre-demographic dividendPuerto RicoQatarRomaniaRussian FederationRwandaSamoaSao Tome and PrincipeSaudi ArabiaSenegalSerbiaSeychellesSierra LeoneSingaporeSlovak RepublicSloveniaSmall statesSolomon IslandsSomaliaSouth AfricaSouth AsiaSouth Asia (IDA & IBRD)South SudanSpainSri LankaSt. Kitts and NevisSt. LuciaSt. Vincent and the GrenadinesSub-Saharan Africa Sub-Saharan Africa (excluding high income)Sub-Saharan Africa (IDA & IBRD countries)SudanSurinameSwazilandSwedenSwitzerlandSyrian Arab RepublicTajikistanTanzaniaThailandTimor-LesteTogoTongaTrinidad and TobagoTunisiaTurkeyTurkmenistanUgandaUkraineUnited Arab EmiratesUnited KingdomUnited StatesUpper middle incomeUruguayUzbekistanVanuatuVenezuela, RBVietnamVirgin Islands (U.S.)West Bank and GazaWorldYemen, Rep.ZambiaZimbabwe línea de tiempo (timeline):
En esta escala de tiempo se presenta un gráfico de 1961 y 2015 de Micronesia, Fed. Sts.. Los datos de 1960 están ausentes. El número de observaciones reales por fecha: 55.
Fuente (nombre):
Indicadores del desarrollo mundial
Fuente (organización):
(1) United Nations Population Division. World Population Prospects. New York, United Nations, Department of Economic and Social Affairs (advanced Excel tables). Available at http://esa.un.org/wpp/unpp/panel_population.htm, (2) University of California, Berkeley, and Max Planck Institute for Demographic Research. Human Mortality Database. [ www.mortality.org or www.humanmortality.de].
Categorías:
Health, Gender
Se ha actualizado:
23 abr 2017 año
Los indicadores de los cambios de valor en los últimos años
Mínimo:
178.442
1 ene 2015 año
Máximo:
304.969
1 ene 1961 año
A la fecha de observación
Valor
Cambio absoluto
El cambio con respecto al valor anterior
1 ene 1961 año
304.969
+304.969
0.0%
1 ene 1962 año
300.409
-4.56
-1.5%
1 ene 1963 año
295.85
-4.559
-1.52%
1 ene 1964 año
291.275
-4.575
-1.55%
1 ene 1965 año
286.7
-4.575
-1.57%
1 ene 1966 año
282.125
-4.575
-1.6%
1 ene 1967 año
277.551
-4.574
-1.62%
1 ene 1968 año
272.976
-4.575
-1.65%
1 ene 1969 año
268.199
-4.777
-1.75%
1 ene 1970 año
263.423
-4.776
-1.78%
1 ene 1971 año
258.646
-4.777
-1.81%
1 ene 1972 año
253.87
-4.776
-1.85%
1 ene 1973 año
249.094
-4.776
-1.88%
1 ene 1974 año
244.354
-4.74
-1.9%
1 ene 1975 año
239.615
-4.739
-1.94%
1 ene 1976 año
234.876
-4.739
-1.98%
1 ene 1977 año
230.137
-4.739
-2.02%
1 ene 1978 año
225.397
-4.74
-2.06%
1 ene 1979 año
224.112
-1.285
-0.57%
1 ene 1980 año
222.827
-1.285
-0.57%
1 ene 1981 año
221.542
-1.285
-0.58%
1 ene 1982 año
220.257
-1.285
-0.58%
1 ene 1983 año
218.971
-1.286
-0.58%
1 ene 1984 año
217.644
-1.327
-0.61%
1 ene 1985 año
216.316
-1.328
-0.61%
1 ene 1986 año
214.989
-1.327
-0.61%
1 ene 1987 año
213.661
-1.328
-0.62%
1 ene 1988 año
212.333
-1.328
-0.62%
1 ene 1989 año
211.016
-1.317
-0.62%
1 ene 1990 año
209.699
-1.317
-0.62%
1 ene 1991 año
208.382
-1.317
-0.63%
1 ene 1992 año
207.065
-1.317
-0.63%
1 ene 1993 año
205.748
-1.317
-0.64%
1 ene 1994 año
204.422
-1.326
-0.64%
1 ene 1995 año
203.095
-1.327
-0.65%
1 ene 1996 año
201.769
-1.326
-0.65%
1 ene 1997 año
200.443
-1.326
-0.66%
1 ene 1998 año
199.116
-1.327
-0.66%
1 ene 1999 año
198.116
-1.0
-0.5%
1 ene 2000 año
197.115
-1.001
-0.51%
1 ene 2001 año
196.114
-1.001
-0.51%
1 ene 2002 año
195.114
-1.0
-0.51%
1 ene 2003 año
194.113
-1.001
-0.51%
1 ene 2004 año
192.574
-1.539
-0.79%
1 ene 2005 año
191.034
-1.54
-0.8%
1 ene 2006 año
189.495
-1.539
-0.81%
1 ene 2007 año
187.955
-1.54
-0.81%
1 ene 2008 año
186.416
-1.539
-0.82%
1 ene 2009 año
185.343
-1.073
-0.58%
1 ene 2010 año
184.271
-1.072
-0.58%
1 ene 2011 año
183.199
-1.072
-0.58%
1 ene 2012 año
182.127
-1.072
-0.59%
1 ene 2013 año
181.055
-1.072
-0.59%
1 ene 2014 año
179.748
-1.307
-0.72%
1 ene 2015 año
178.442
-1.306
-0.73%
Ranking de los países por los datos estadísticos actuales


Comentarios: