Download This statistics in other country:
Timeline:
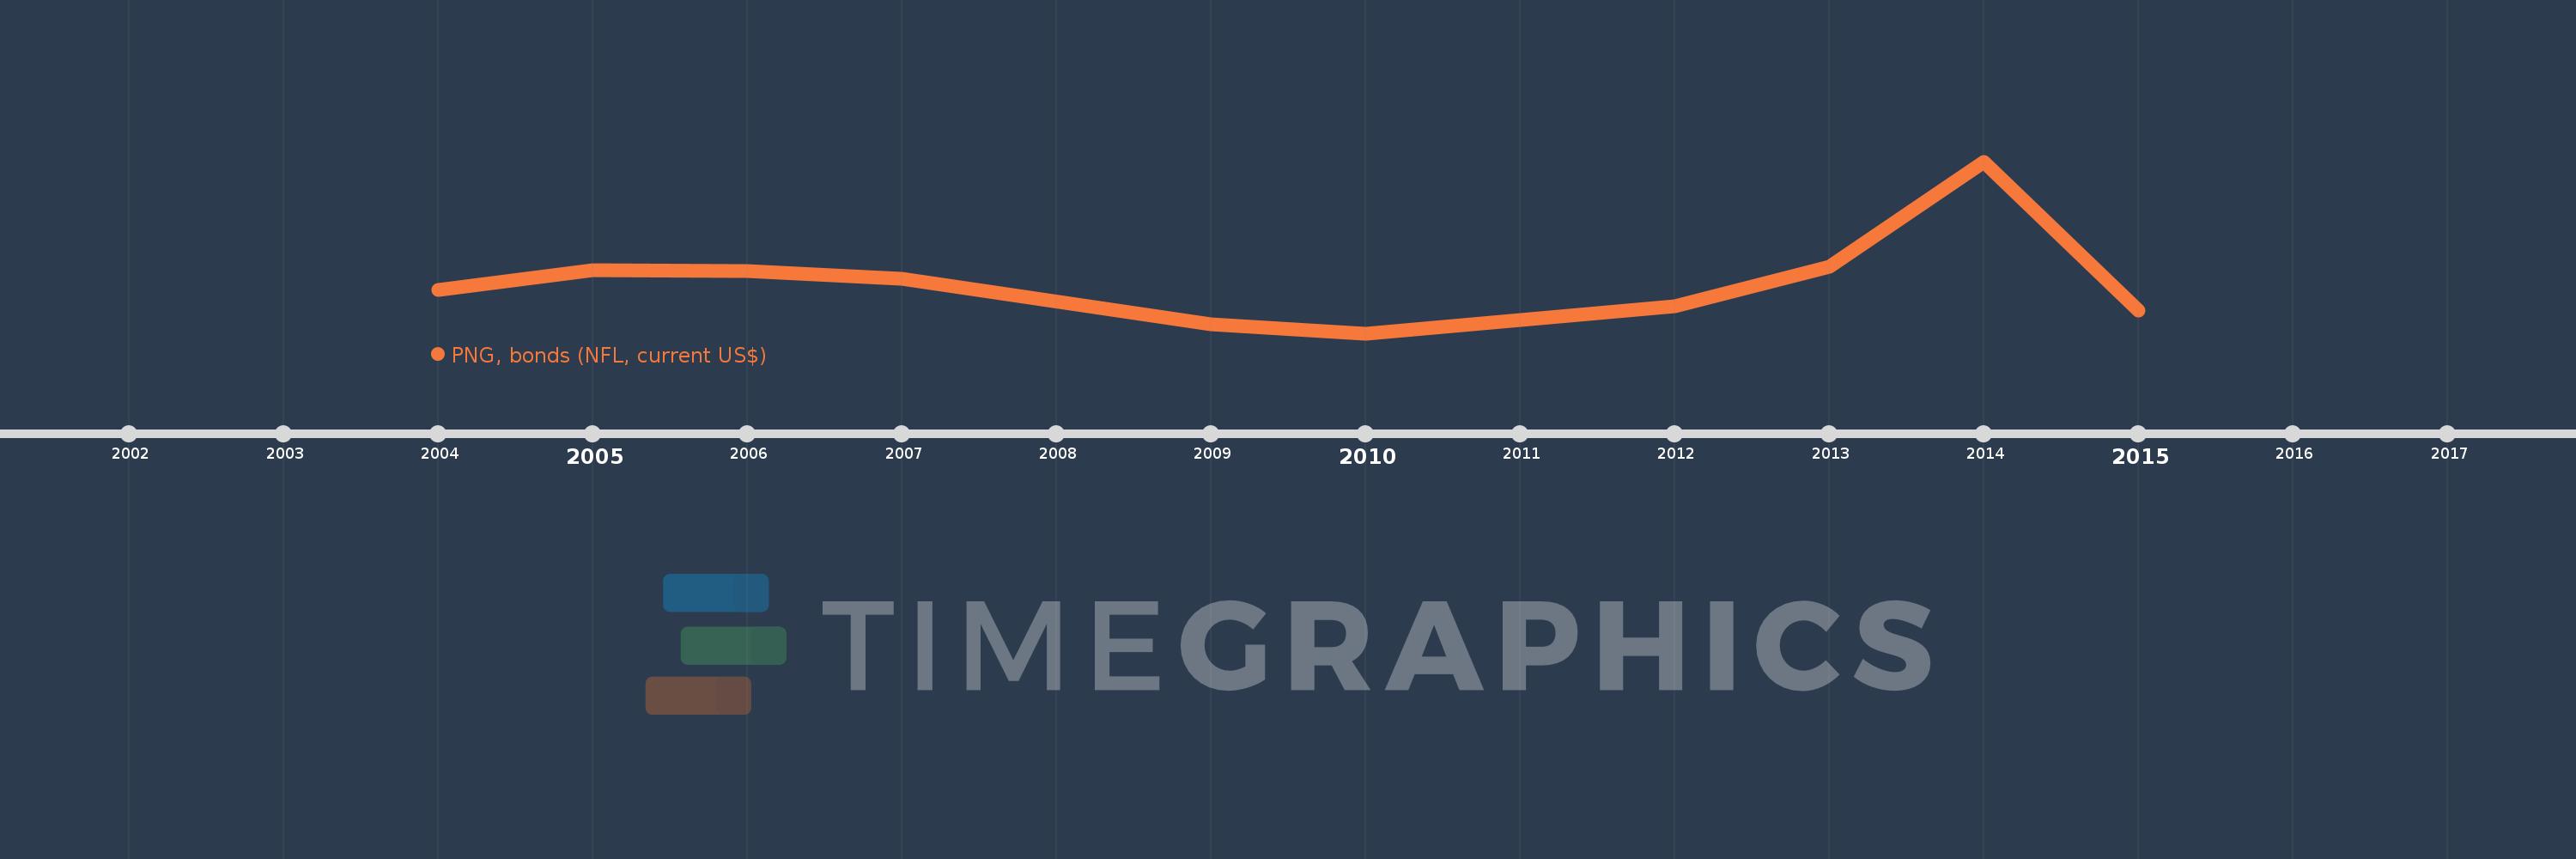
This timeline shows a graph from 2004 to 2015 of Bulgaria. No data until 2003. Number of actual observations by date: 10.
Source name:
World Development Indicators
Source organization:
World Bank, International Debt Statistics.
Categories, topics:
External Debt
Last updated:
apr 23, 2017
Indicators value changes by year
Minimum:
-372.317 mln
jan 1, 2010
Maximum:
1.32 bln
jan 1, 2014
At the date of observation
Value
Absolute change
Change from the previous value
jan 1, 2004
52.018 mln
+52.018 mln
0.0%
jan 1, 2005
253.321 mln
+201.303 mln
386.99%
jan 1, 2006
239.151 mln
-14.17 mln
-5.59%
jan 1, 2007
166.085 mln
-73.066 mln
-30.55%
jan 1, 2009
-286.69 mln
-452.775 mln
-272.62%
jan 1, 2010
-372.317 mln
-85.627 mln
29.87%
jan 1, 2012
-109.141 mln
+263.176 mln
-70.69%
jan 1, 2013
282.522 mln
+391.663 mln
-358.86%
jan 1, 2014
1.32 bln
+1.037 bln
367.22%
jan 1, 2015
-150.0 mln
-1.47 bln
-111.36%
Ranking of countries by current statistics by years