Download This statistics in other country:
Timeline:
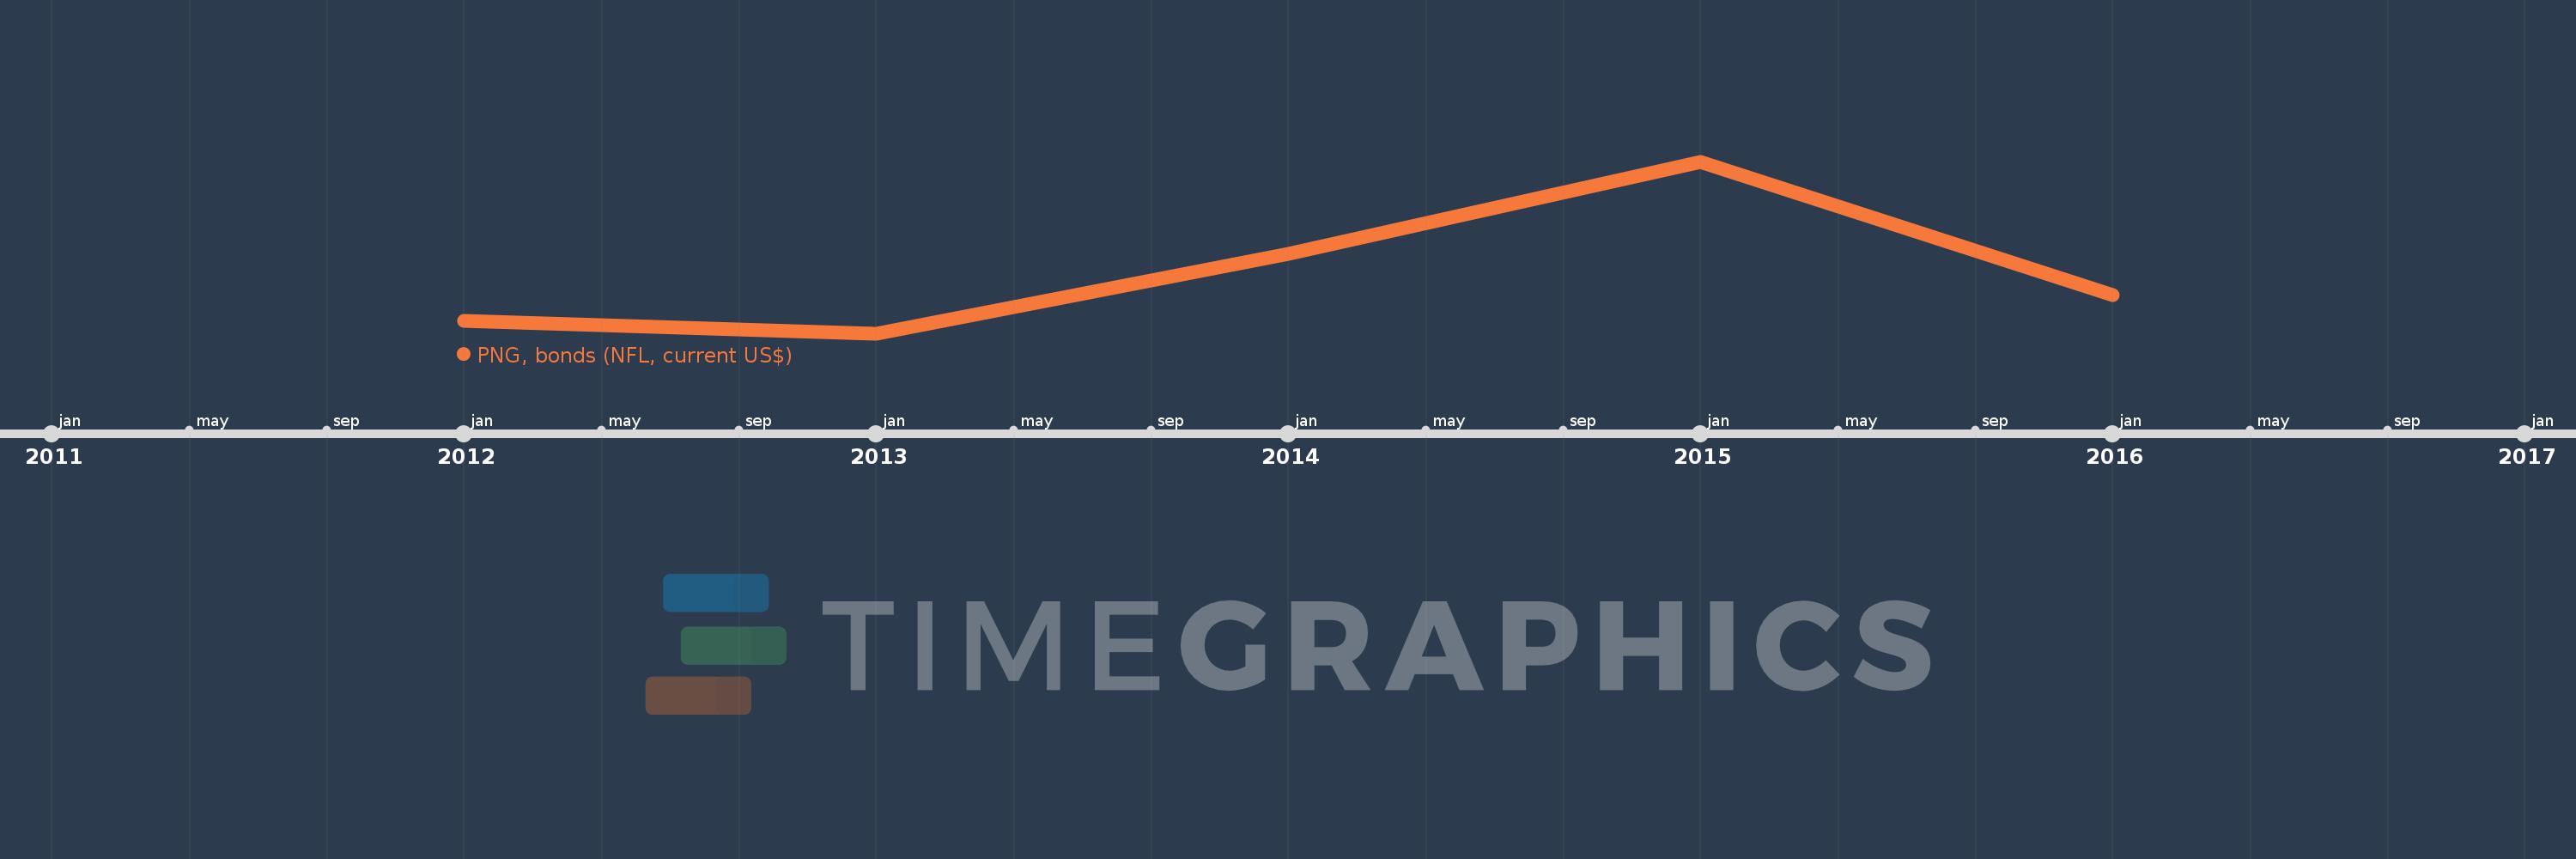
This timeline shows a graph from 2012 to 2016 of Nigeria. No data until 2011. Number of actual observations by date: 5.
Source name:
World Development Indicators
Source organization:
World Bank, International Debt Statistics.
Categories, topics:
External Debt
Last updated:
apr 23, 2017
Indicators value changes by year
Minimum:
350.0 mln
jan 1, 2013
Maximum:
2.35 bln
jan 1, 2015
At the date of observation
Value
Absolute change
Change from the previous value
jan 1, 2012
500.0 mln
+500.0 mln
0.0%
jan 1, 2013
350.0 mln
-150.0 mln
-30.0%
jan 1, 2014
1.275 bln
+925.0 mln
264.29%
jan 1, 2015
2.35 bln
+1.075 bln
84.31%
jan 1, 2016
800.0 mln
-1.55 bln
-65.96%
Ranking of countries by current statistics by years