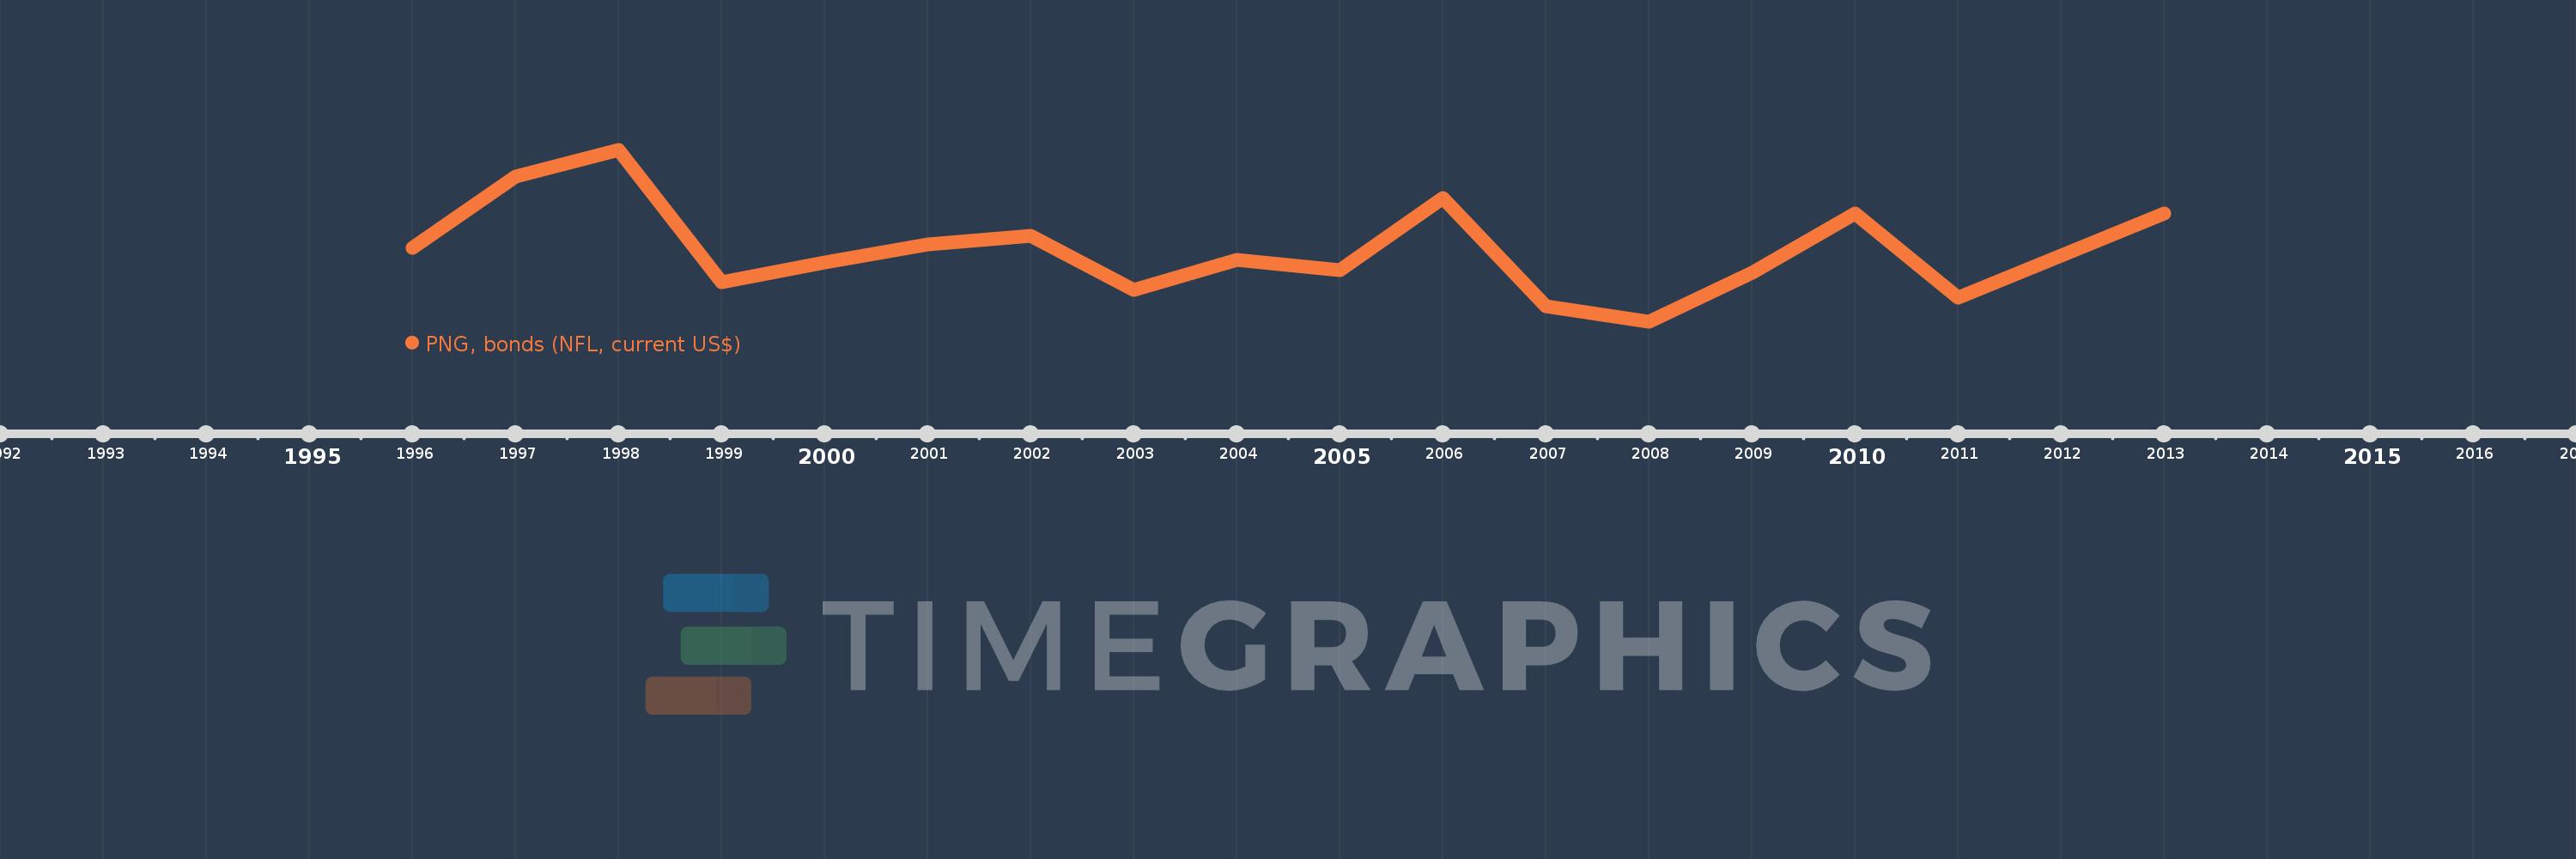
This timeline shows a graph from 1996 to 2013 of Middle East & North Africa (excluding high income). No data until 1995. Number of actual observations by date: 17.
Source name:
World Development Indicators
Source organization:
World Bank, International Debt Statistics.
Categories, topics:
External Debt
Last updated:
apr 23, 2017
Indicators value changes by year
Meaning:
41.176 mln
Minimum:
-275.0 mln
jan 1, 2008
Maximum:
475.0 mln
jan 1, 1998
At the date of observation
Value
Absolute change
Change from the previous value
jan 1, 1996
50.0 mln
+50.0 mln
0.0%
jan 1, 1997
360.0 mln
+310.0 mln
620.0%
jan 1, 1998
475.0 mln
+115.0 mln
31.94%
jan 1, 1999
-100.0 mln
-575.0 mln
-121.05%
jan 1, 2000
-14.0 mln
+86.0 mln
-86.0%
jan 1, 2001
65.0 mln
+79.0 mln
-564.29%
jan 1, 2002
100.0 mln
+35.0 mln
53.85%
jan 1, 2003
-135.0 mln
-235.0 mln
-235.0%
jan 1, 2004
-5.0 mln
+130.0 mln
-96.3%
jan 1, 2005
-50.0 mln
-45.0 mln
900.0%
jan 1, 2006
265.0 mln
+315.0 mln
-630.0%
jan 1, 2007
-206.0 mln
-471.0 mln
-177.74%
jan 1, 2008
-275.0 mln
-69.0 mln
33.5%
jan 1, 2009
-60.0 mln
+215.0 mln
-78.18%
jan 1, 2010
200.0 mln
+260.0 mln
-433.33%
jan 1, 2011
-170.0 mln
-370.0 mln
-185.0%
jan 1, 2013
200.0 mln
+370.0 mln
-217.65%
Ranking of countries by current statistics by years