33
/
AIzaSyB4mHJ5NPEv-XzF7P6NDYXjlkCWaeKw5bc
November 30, 2025
166639
Kazakhstan
KAZ
true
2
1
PNG, bonds (NFL, current US$)
2016,2015,2014,2013,2012,2011,2010,2009,2008,2007,2006,2005,2004,2003,2002,1999
Create a timeline
Public Timelines
For education
For educational institutions
For teachers
For students
Cabinet
For educational institutions
For teachers
For students
Open cabinet
FAQ
Close
Create a timeline
Public timelines
FAQ
About & Feedback
Terms
Privacy
FAQ
Support 24/7
Cabinet
Get premium
Donate
Download
Global statistics library
→
Kazakhstan
→
PNG, bonds (NFL, current US$)
This statistics in other country:
Argentina
Armenia
Botswana
Brazil
Bulgaria
China
Colombia
Costa Rica
Dominican Republic
East Asia & Pacific (excluding high income)
Ecuador
Egypt, Arab Rep.
El Salvador
Europe & Central Asia (excluding high income)
Georgia
Ghana
Guatemala
IDA only
India
Indonesia
Jamaica
Kazakhstan
Lao PDR
Latin America & Caribbean (excluding high income)
Lebanon
Low & middle income
Lower middle income
Malaysia
Mexico
Middle East & North Africa (excluding high income)
Middle income
Mongolia
Nigeria
Pakistan
Panama
Paraguay
Peru
Philippines
Romania
Russian Federation
Serbia
South Africa
South Asia
Sri Lanka
Sub-Saharan Africa (excluding high income)
Thailand
Turkey
Ukraine
Upper middle income
Venezuela, RB
Vietnam
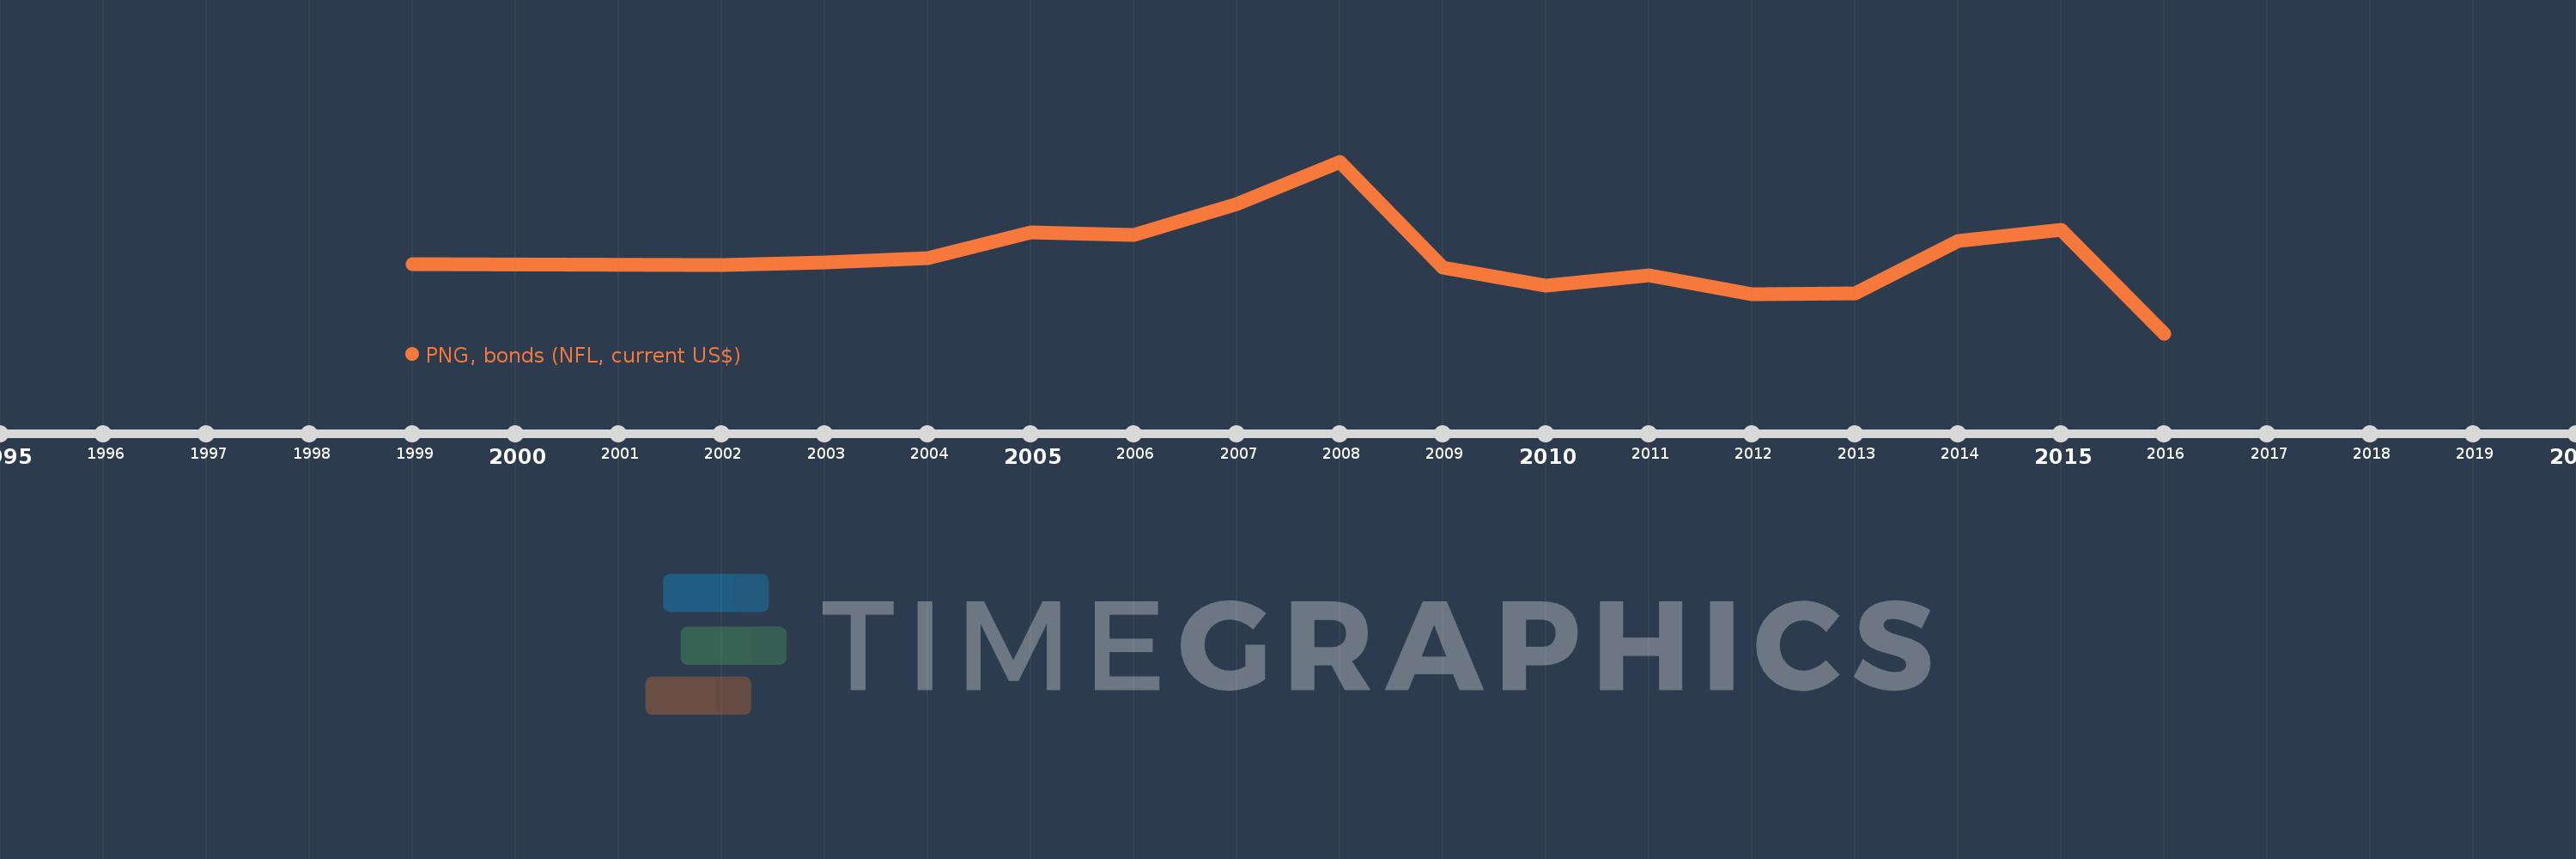
Timeline:
This timeline shows a graph from
1999
to
2016
of Kazakhstan. No data until
1998
. Number of actual observations by date:
16
.
Source name:
World Development Indicators
Source organization:
World Bank, International Debt Statistics.
Categories, topics:
External Debt
Last updated:
apr 23, 2017
Indicators value changes by year
Meaning:
880.227 mln
Minimum:
-6.998 bln
jan 1, 2016
Maximum:
10.593 bln
jan 1, 2008
At the date of observation
Value
Absolute change
Change from the previous value
jan 1, 1999
100.0 mln
+100.0 mln
0.0%
jan 1, 2002
0.0
-100.0 mln
-100.0%
jan 1, 2003
300.0 mln
+300.0 mln
%
jan 1, 2004
725.0 mln
+425.0 mln
141.67%
jan 1, 2005
3.375 bln
+2.65 bln
365.52%
jan 1, 2006
3.05 bln
-325.0 mln
-9.63%
jan 1, 2007
6.219 bln
+3.169 bln
103.9%
jan 1, 2008
10.593 bln
+4.375 bln
70.34%
jan 1, 2009
-310.0 mln
-10.903 bln
-102.93%
jan 1, 2010
-2.108 bln
-1.798 bln
579.91%
jan 1, 2011
-1.053 bln
+1.054 bln
-50.03%
jan 1, 2012
-2.989 bln
-1.935 bln
183.73%
jan 1, 2013
-2.897 bln
+91.579 mln
-3.06%
jan 1, 2014
2.475 bln
+5.372 bln
-185.43%
jan 1, 2015
3.601 bln
+1.126 bln
45.49%
jan 1, 2016
-6.998 bln
-10.598 bln
-294.35%
Ranking of countries by current statistics by years
About & Feedback
Terms
Privacy
FAQ
Support 24/7
Cabinet
Get premium
Donate
The service accepts bank transfer (ACH, Wire) or cards (Visa, MasterCard, etc). Processed by Stripe.
Secured with SSL