Download This statistics in other country:
Timeline:
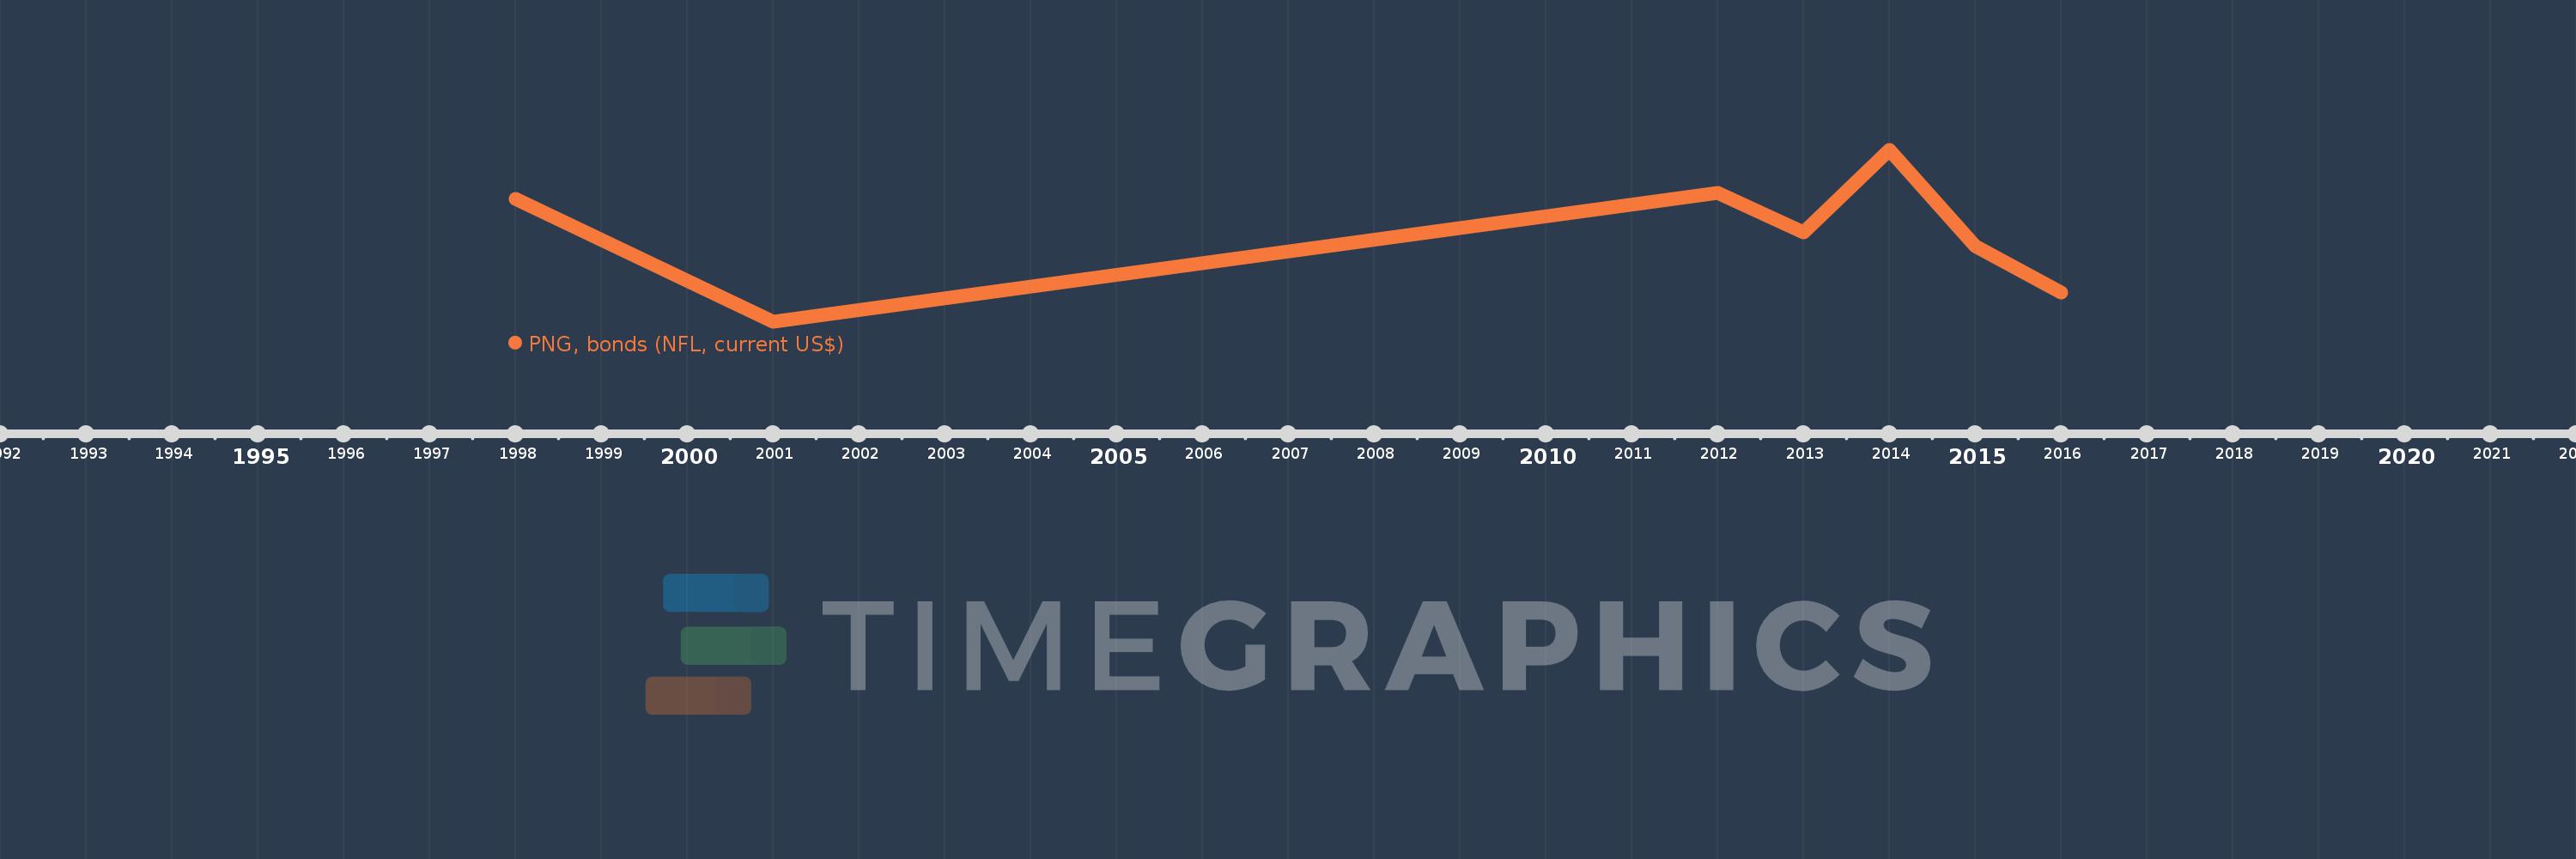
This timeline shows a graph from 1998 to 2016 of Romania. No data until 1997. Number of actual observations by date: 7.
Source name:
World Development Indicators
Source organization:
World Bank, International Debt Statistics.
Categories, topics:
External Debt
Last updated:
apr 23, 2017
Indicators value changes by year
Minimum:
-75.0 mln
jan 1, 2001
Maximum:
134.645 mln
jan 1, 2014
At the date of observation
Value
Absolute change
Change from the previous value
jan 1, 1998
75.0 mln
+75.0 mln
0.0%
jan 1, 2001
-75.0 mln
-150.0 mln
-200.0%
jan 1, 2012
82.931 mln
+157.931 mln
-210.57%
jan 1, 2013
33.919 mln
-49.012 mln
-59.1%
jan 1, 2014
134.645 mln
+100.726 mln
296.96%
jan 1, 2015
17.78 mln
-116.865 mln
-86.79%
jan 1, 2016
-38.616 mln
-56.396 mln
-317.19%
Ranking of countries by current statistics by years