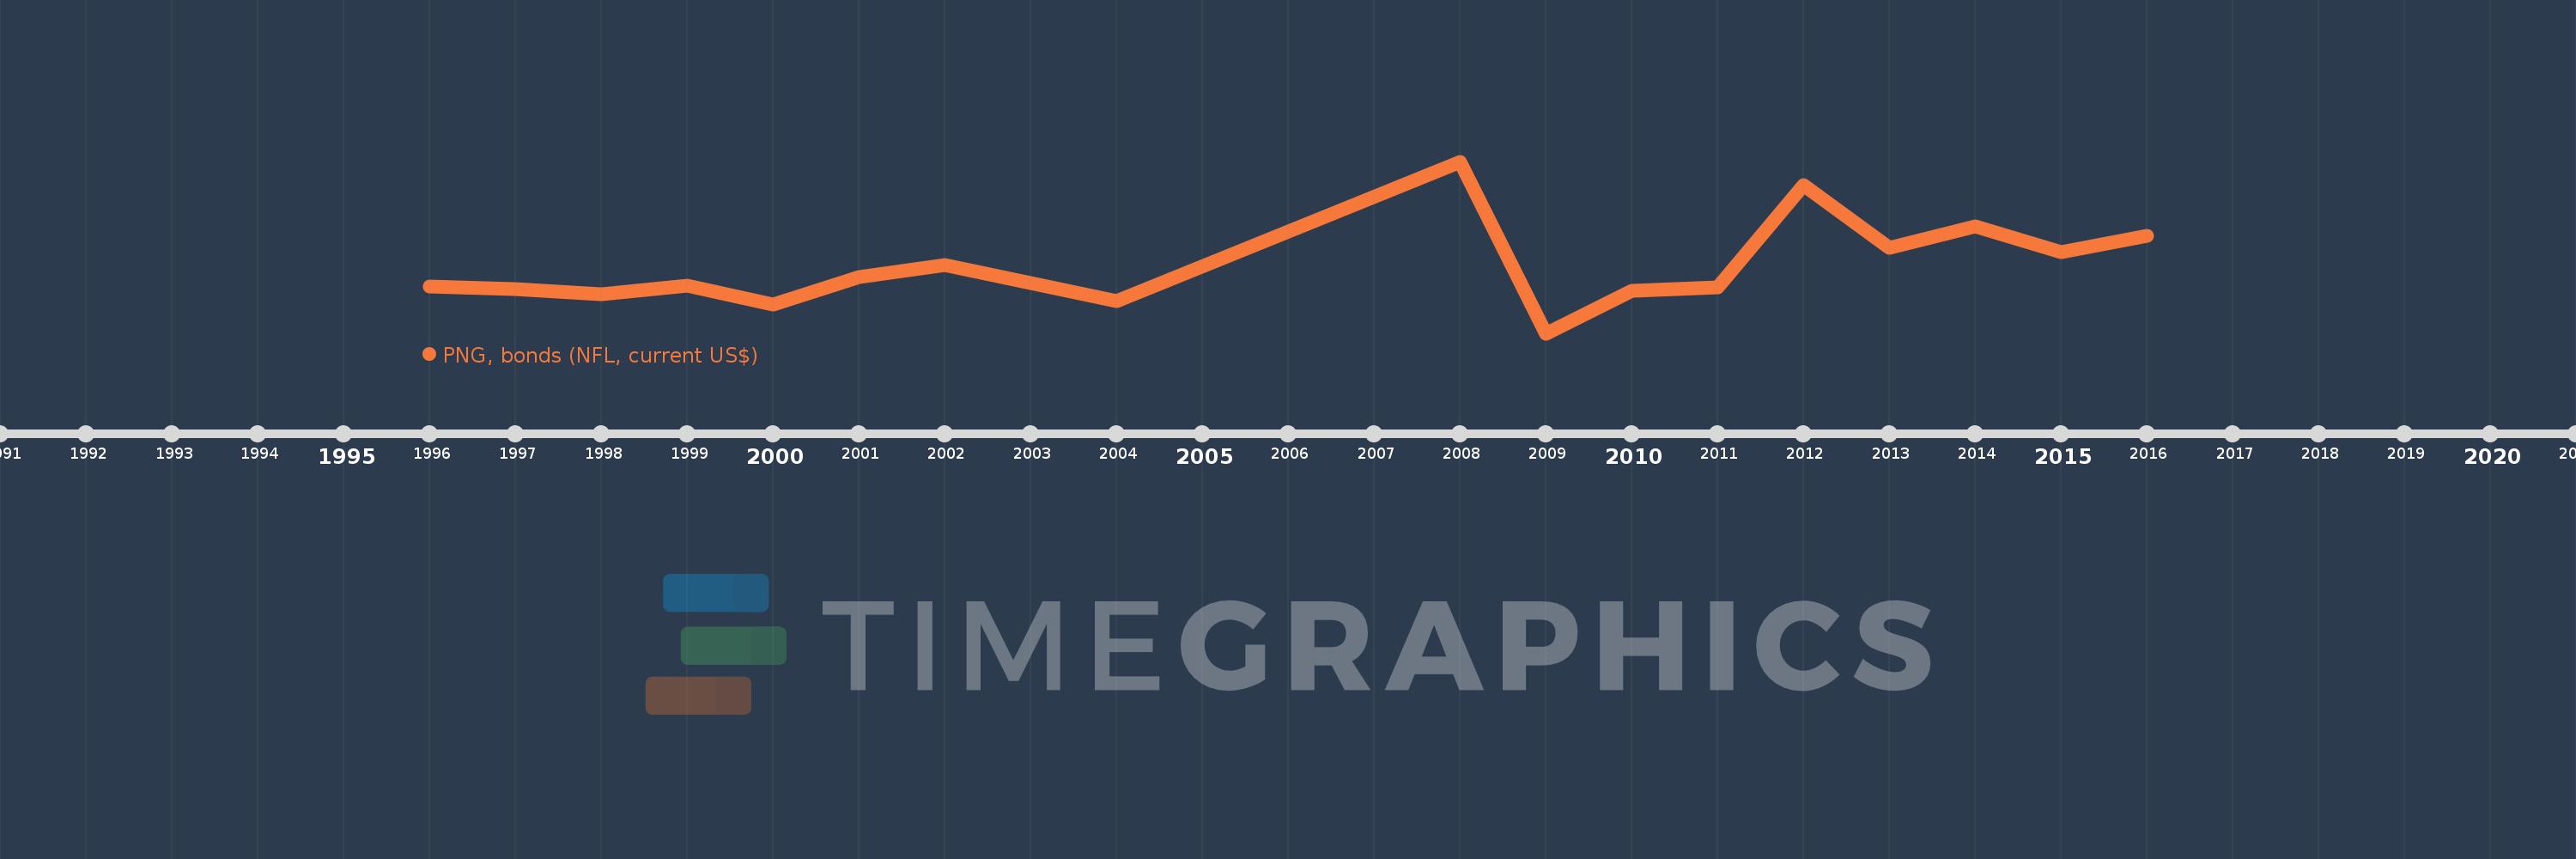
This timeline shows a graph from 1996 to 2016 of Sub-Saharan Africa (excluding high income). No data until 1995. Number of actual observations by date: 17.
Source name:
World Development Indicators
Source organization:
World Bank, International Debt Statistics.
Categories, topics:
External Debt
Last updated:
apr 23, 2017
Indicators value changes by year
Meaning:
1.151 bln
Minimum:
-1.513 bln
jan 1, 2009
Maximum:
5.3 bln
jan 1, 2008
At the date of observation
Value
Absolute change
Change from the previous value
jan 1, 1996
350.0 mln
+350.0 mln
0.0%
jan 1, 1997
250.0 mln
-100.0 mln
-28.57%
jan 1, 1998
45.0 mln
-205.0 mln
-82.0%
jan 1, 1999
373.047 mln
+328.047 mln
728.99%
jan 1, 2000
-357.75 mln
-730.797 mln
-195.9%
jan 1, 2001
712.011 mln
+1.07 bln
-299.02%
jan 1, 2002
1.205 bln
+492.989 mln
69.24%
jan 1, 2004
-250.0 mln
-1.455 bln
-120.75%
jan 1, 2008
5.3 bln
+5.55 bln
-2.22K%
jan 1, 2009
-1.513 bln
-6.813 bln
-128.55%
jan 1, 2010
163.0 mln
+1.676 bln
-110.77%
jan 1, 2011
301.0 mln
+138.0 mln
84.66%
jan 1, 2012
4.352 bln
+4.051 bln
1.35K%
jan 1, 2013
1.861 bln
-2.491 bln
-57.25%
jan 1, 2014
2.734 bln
+873.524 mln
46.95%
jan 1, 2015
1.708 bln
-1.026 bln
-37.52%
jan 1, 2016
2.34 bln
+631.866 mln
36.99%
Ranking of countries by current statistics by years