Download This statistics in other country:
Timeline:
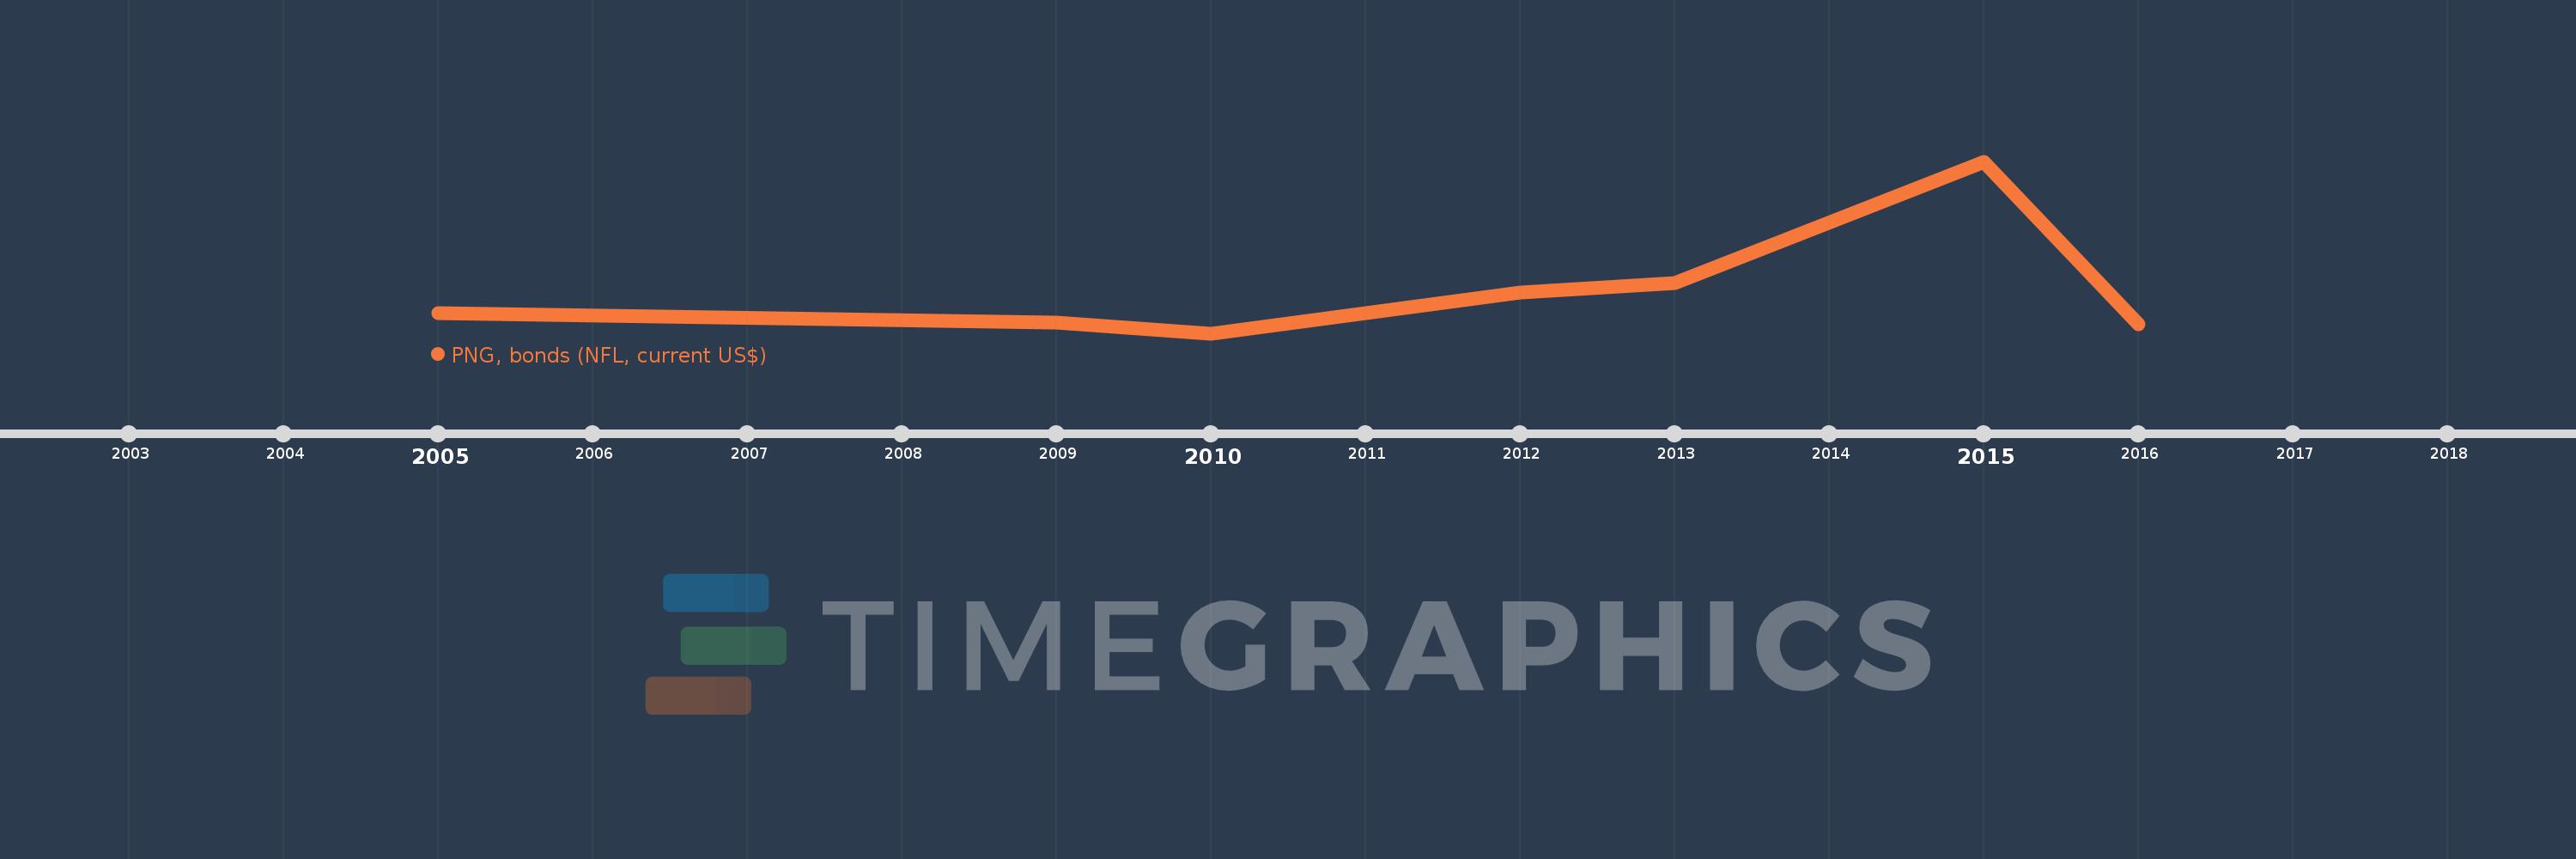
This timeline shows a graph from 2005 to 2016 of Guatemala. No data until 2004. Number of actual observations by date: 7.
Source name:
World Development Indicators
Source organization:
World Bank, International Debt Statistics.
Categories, topics:
External Debt
Last updated:
apr 23, 2017
Indicators value changes by year
Minimum:
-50.0 mln
jan 1, 2010
Maximum:
800.0 mln
jan 1, 2015
At the date of observation
Value
Absolute change
Change from the previous value
jan 1, 2005
50.0 mln
+50.0 mln
0.0%
jan 1, 2009
5.0 mln
-45.0 mln
-90.0%
jan 1, 2010
-50.0 mln
-55.0 mln
-1.1K%
jan 1, 2012
150.0 mln
+200.0 mln
-400.0%
jan 1, 2013
200.0 mln
+50.0 mln
33.33%
jan 1, 2015
800.0 mln
+600.0 mln
300.0%
jan 1, 2016
-5.0 mln
-805.0 mln
-100.63%
Ranking of countries by current statistics by years