33
/
AIzaSyB4mHJ5NPEv-XzF7P6NDYXjlkCWaeKw5bc
November 30, 2025
269835
Turkey
TUR
true
2
1
PNG, bonds (NFL, current US$)
2016,2015,2014,2013,2012,2011,2010,2009,2008,2007,2006,2005,2004,2003,2002,2001,2000,1999,1998,1997,1995,1994,1993,1990
Create a timeline
Public Timelines
For education
For educational institutions
For teachers
For students
Cabinet
For educational institutions
For teachers
For students
Open cabinet
FAQ
Close
Create a timeline
Public timelines
FAQ
About & Feedback
Terms
Privacy
FAQ
Support 24/7
Cabinet
Get premium
Donate
Download
Global statistics library
→
Turkey
→
PNG, bonds (NFL, current US$)
This statistics in other country:
Argentina
Armenia
Botswana
Brazil
Bulgaria
China
Colombia
Costa Rica
Dominican Republic
East Asia & Pacific (excluding high income)
Ecuador
Egypt, Arab Rep.
El Salvador
Europe & Central Asia (excluding high income)
Georgia
Ghana
Guatemala
IDA only
India
Indonesia
Jamaica
Kazakhstan
Lao PDR
Latin America & Caribbean (excluding high income)
Lebanon
Low & middle income
Lower middle income
Malaysia
Mexico
Middle East & North Africa (excluding high income)
Middle income
Mongolia
Nigeria
Pakistan
Panama
Paraguay
Peru
Philippines
Romania
Russian Federation
Serbia
South Africa
South Asia
Sri Lanka
Sub-Saharan Africa (excluding high income)
Thailand
Turkey
Ukraine
Upper middle income
Venezuela, RB
Vietnam
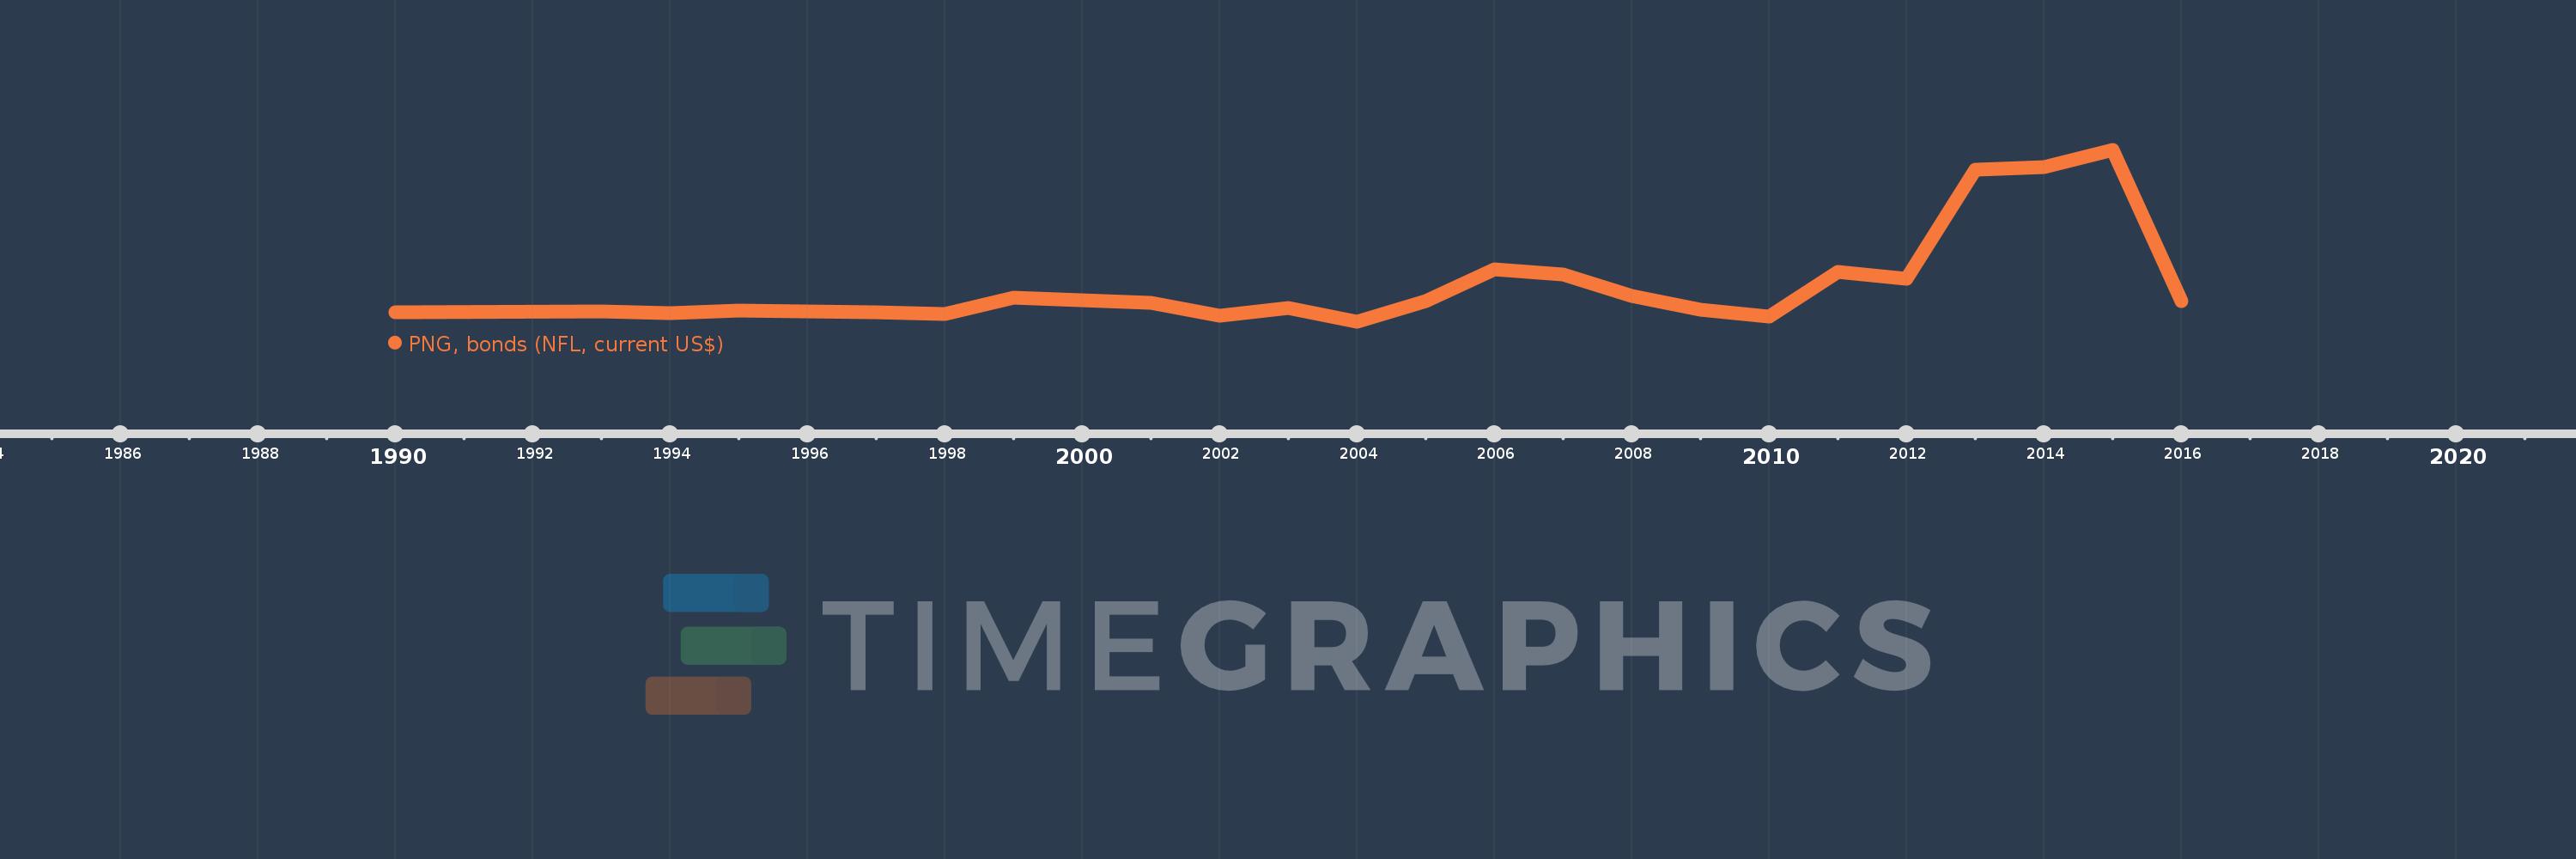
Timeline:
This timeline shows a graph from
1990
to
2016
of Turkey. No data until
1989
. Number of actual observations by date:
24
.
Source name:
World Development Indicators
Source organization:
World Bank, International Debt Statistics.
Categories, topics:
External Debt
Last updated:
apr 23, 2017
Indicators value changes by year
Meaning:
1.292 bln
Minimum:
-430.978 mln
jan 1, 2004
Maximum:
7.44 bln
jan 1, 2015
At the date of observation
Value
Absolute change
Change from the previous value
jan 1, 1990
16.0 mln
+16.0 mln
0.0%
jan 1, 1993
50.0 mln
+34.0 mln
212.5%
jan 1, 1994
-16.0 mln
-66.0 mln
-132.0%
jan 1, 1995
99.45 mln
+115.45 mln
-721.56%
jan 1, 1997
25.0 mln
-74.45 mln
-74.86%
jan 1, 1998
-50.0 mln
-75.0 mln
-300.0%
jan 1, 1999
670.0 mln
+720.0 mln
-1.44K%
jan 1, 2000
552.02 mln
-117.98 mln
-17.61%
jan 1, 2001
454.106 mln
-97.914 mln
-17.74%
jan 1, 2002
-124.45 mln
-578.556 mln
-127.41%
jan 1, 2003
200.0 mln
+324.45 mln
-260.71%
jan 1, 2004
-430.978 mln
-630.978 mln
-315.49%
jan 1, 2005
527.758 mln
+958.736 mln
-222.46%
jan 1, 2006
1.975 bln
+1.447 bln
274.22%
jan 1, 2007
1.727 bln
-248.029 mln
-12.56%
jan 1, 2008
750.0 mln
-976.971 mln
-56.57%
jan 1, 2009
150.0 mln
-600.0 mln
-80.0%
jan 1, 2010
-200.0 mln
-350.0 mln
-233.33%
jan 1, 2011
1.88 bln
+2.08 bln
-1.04K%
jan 1, 2012
1.563 bln
-317.196 mln
-16.87%
jan 1, 2013
6.561 bln
+4.998 bln
319.82%
jan 1, 2014
6.67 bln
+108.511 mln
1.65%
jan 1, 2015
7.44 bln
+770.252 mln
11.55%
jan 1, 2016
516.757 mln
-6.923 bln
-93.05%
Ranking of countries by current statistics by years
About & Feedback
Terms
Privacy
FAQ
Support 24/7
Cabinet
Get premium
Donate
The service accepts bank transfer (ACH, Wire) or cards (Visa, MasterCard, etc). Processed by Stripe.
Secured with SSL