33
/
AIzaSyB4mHJ5NPEv-XzF7P6NDYXjlkCWaeKw5bc
November 30, 2025
196051
Mexico
MEX
true
2
1
PNG, bonds (NFL, current US$)
2016,2015,2014,2013,2012,2011,2010,2009,2008,2007,2006,2005,2004,2003,2002,2001,2000,1999,1998,1997,1996,1995,1994,1993,1992,1991
Create a timeline
Public Timelines
For education
For educational institutions
For teachers
For students
Cabinet
For educational institutions
For teachers
For students
Open cabinet
FAQ
Close
Create a timeline
Public timelines
FAQ
About & Feedback
Terms
Privacy
FAQ
Support 24/7
Cabinet
Get premium
Donate
Download
Global statistics library
→
Mexico
→
PNG, bonds (NFL, current US$)
This statistics in other country:
Argentina
Armenia
Botswana
Brazil
Bulgaria
China
Colombia
Costa Rica
Dominican Republic
East Asia & Pacific (excluding high income)
Ecuador
Egypt, Arab Rep.
El Salvador
Europe & Central Asia (excluding high income)
Georgia
Ghana
Guatemala
IDA only
India
Indonesia
Jamaica
Kazakhstan
Lao PDR
Latin America & Caribbean (excluding high income)
Lebanon
Low & middle income
Lower middle income
Malaysia
Mexico
Middle East & North Africa (excluding high income)
Middle income
Mongolia
Nigeria
Pakistan
Panama
Paraguay
Peru
Philippines
Romania
Russian Federation
Serbia
South Africa
South Asia
Sri Lanka
Sub-Saharan Africa (excluding high income)
Thailand
Turkey
Ukraine
Upper middle income
Venezuela, RB
Vietnam
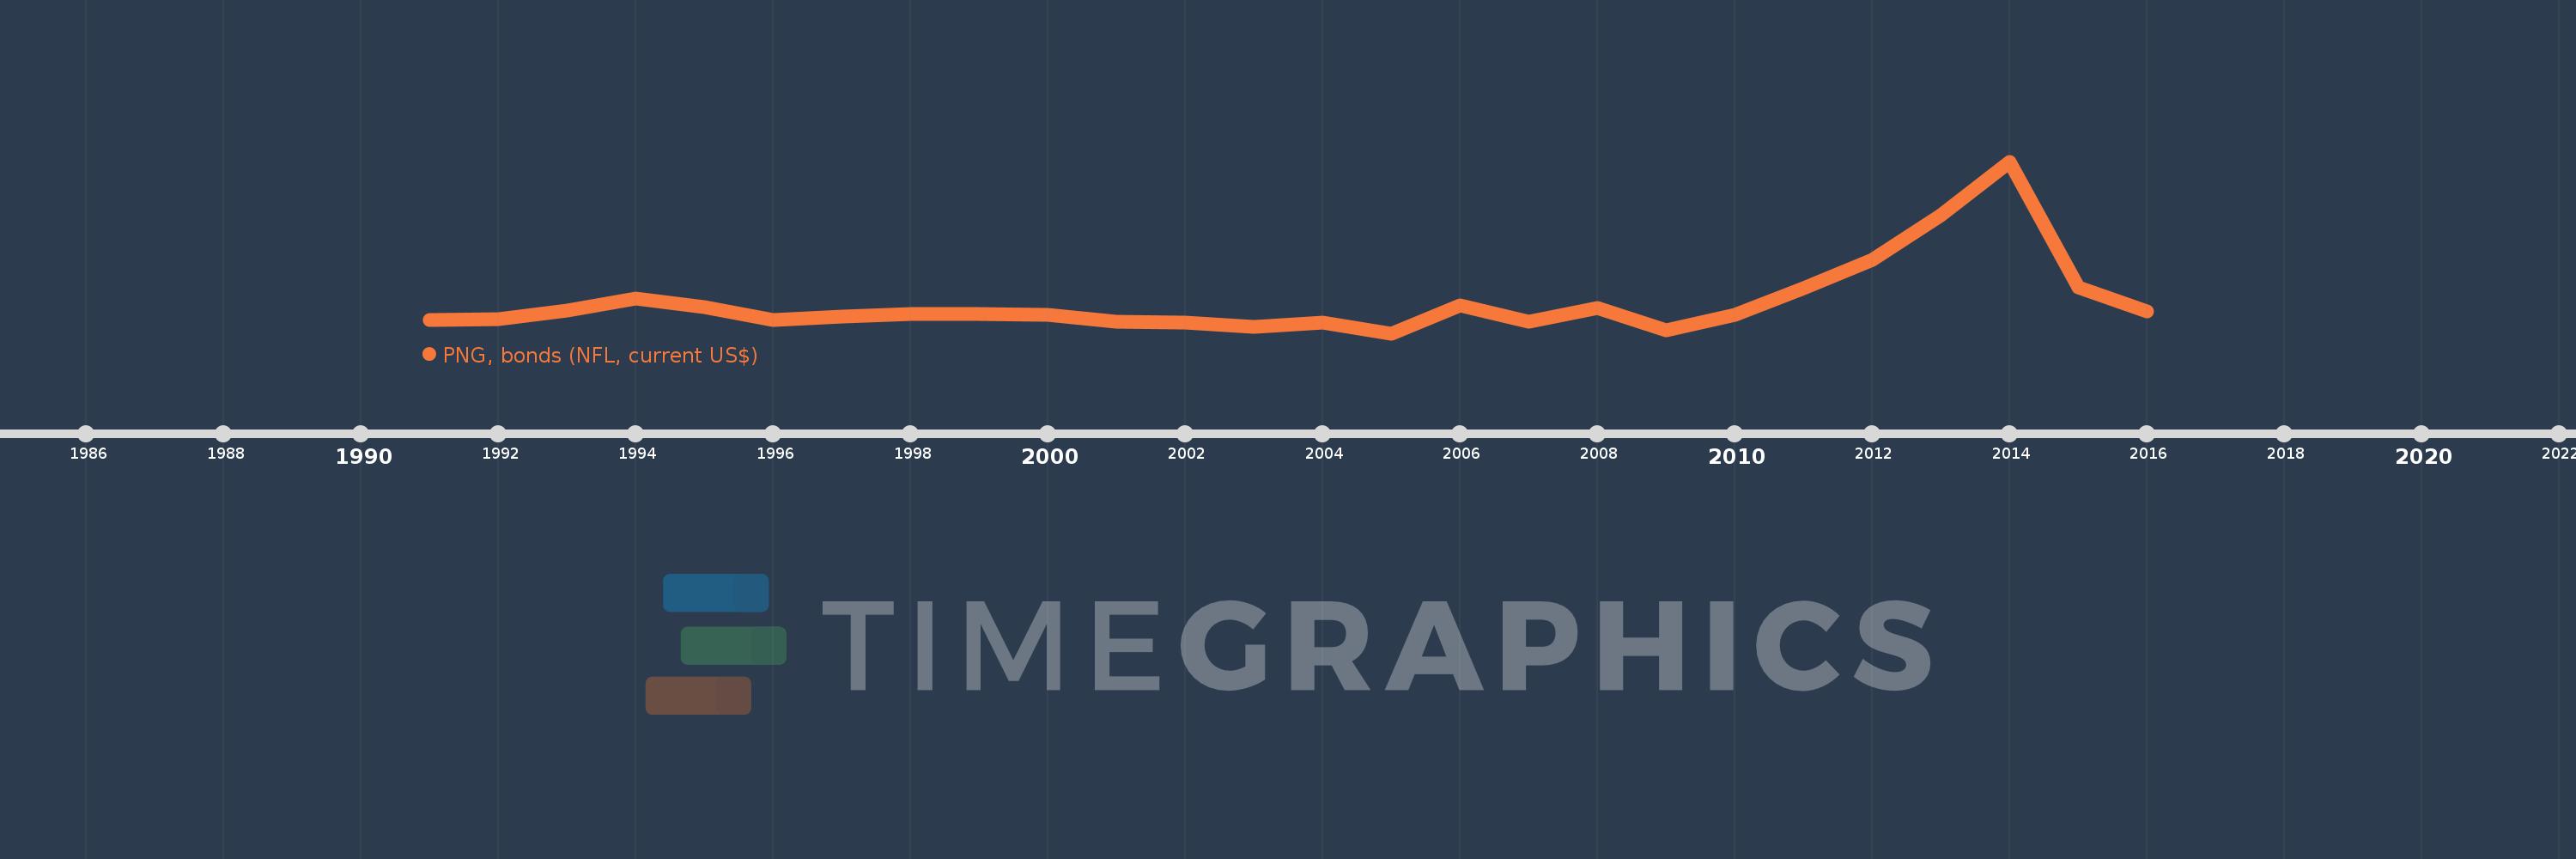
Timeline:
This timeline shows a graph from
1991
to
2016
of Mexico. No data until
1990
. Number of actual observations by date:
26
.
Source name:
World Development Indicators
Source organization:
World Bank, International Debt Statistics.
Categories, topics:
External Debt
Last updated:
apr 23, 2017
Indicators value changes by year
Meaning:
4.744 bln
Minimum:
-3.188 bln
jan 1, 2005
Maximum:
41.165 bln
jan 1, 2014
At the date of observation
Value
Absolute change
Change from the previous value
jan 1, 1991
150.0 mln
+150.0 mln
0.0%
jan 1, 1992
552.875 mln
+402.875 mln
268.58%
jan 1, 1993
2.616 bln
+2.063 bln
373.17%
jan 1, 1994
5.836 bln
+3.219 bln
123.07%
jan 1, 1995
3.607 bln
-2.228 bln
-38.18%
jan 1, 1996
233.2 mln
-3.374 bln
-93.54%
jan 1, 1997
1.105 bln
+871.925 mln
373.9%
jan 1, 1998
1.74 bln
+635.131 mln
57.47%
jan 1, 1999
1.708 bln
-32.479 mln
-1.87%
jan 1, 2000
1.611 bln
-96.533 mln
-5.65%
jan 1, 2001
-206.091 mln
-1.817 bln
-112.79%
jan 1, 2002
-463.002 mln
-256.911 mln
124.66%
jan 1, 2003
-1.578 bln
-1.115 bln
240.82%
jan 1, 2004
-480.45 mln
+1.098 bln
-69.55%
jan 1, 2005
-3.188 bln
-2.707 bln
563.51%
jan 1, 2006
4.023 bln
+7.211 bln
-226.21%
jan 1, 2007
-196.755 mln
-4.22 bln
-104.89%
jan 1, 2008
3.29 bln
+3.487 bln
-1.77K%
jan 1, 2009
-2.316 bln
-5.606 bln
-170.4%
jan 1, 2010
1.567 bln
+3.883 bln
-167.66%
jan 1, 2011
8.472 bln
+6.905 bln
440.65%
jan 1, 2012
15.849 bln
+7.377 bln
87.07%
jan 1, 2013
27.282 bln
+11.433 bln
72.14%
jan 1, 2014
41.165 bln
+13.883 bln
50.89%
jan 1, 2015
8.593 bln
-32.572 bln
-79.12%
jan 1, 2016
2.371 bln
-6.222 bln
-72.41%
Ranking of countries by current statistics by years
About & Feedback
Terms
Privacy
FAQ
Support 24/7
Cabinet
Get premium
Donate
The service accepts bank transfer (ACH, Wire) or cards (Visa, MasterCard, etc). Processed by Stripe.
Secured with SSL