33
/
AIzaSyB4mHJ5NPEv-XzF7P6NDYXjlkCWaeKw5bc
November 30, 2025
155102
India
IND
true
2
1
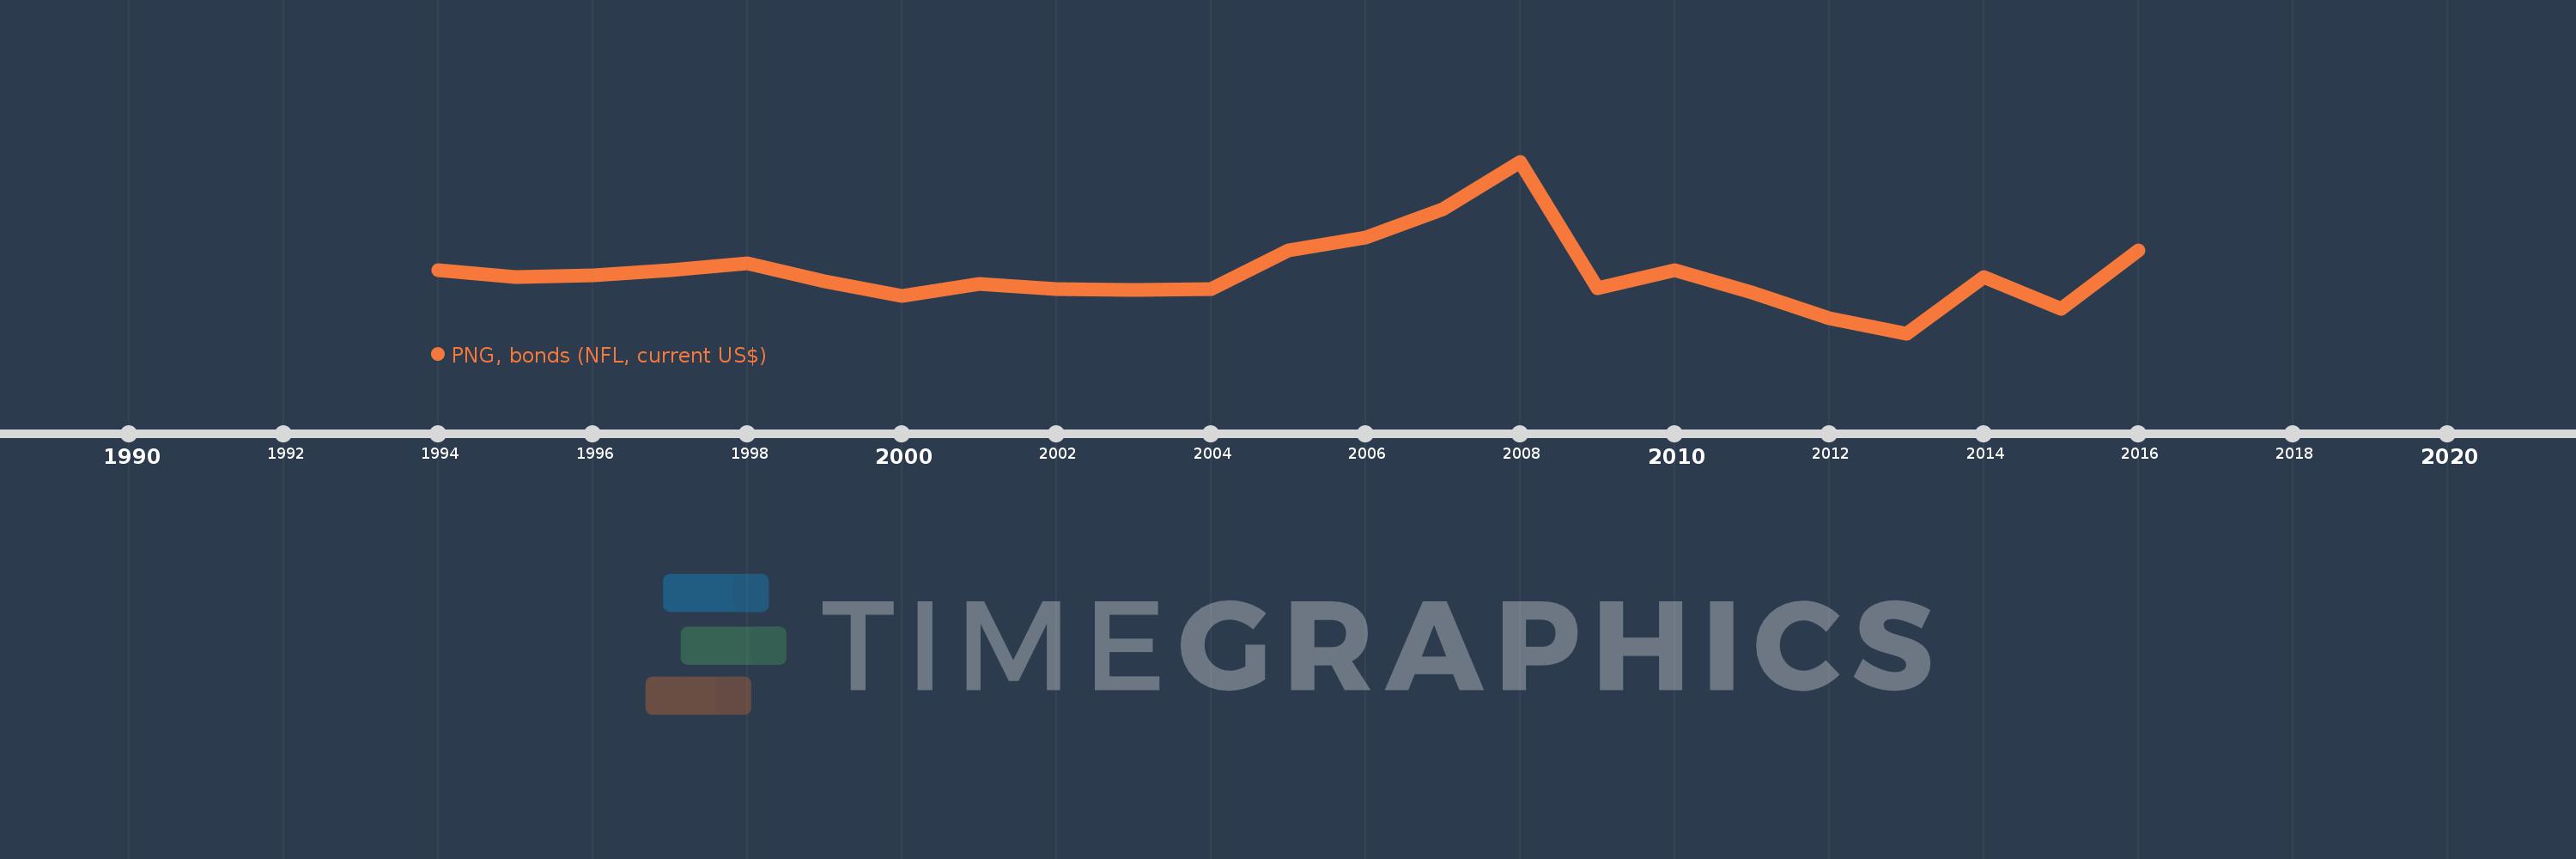
PNG, bonds (NFL, current US$)
2016,2015,2014,2013,2012,2011,2010,2009,2008,2007,2006,2005,2004,2003,2002,2001,2000,1999,1998,1997,1996,1995,1994
Create a timeline
Public Timelines
For education
For educational institutions
For teachers
For students
Cabinet
For educational institutions
For teachers
For students
Open cabinet
FAQ
Close
Create a timeline
Public timelines
FAQ
About & Feedback
Terms
Privacy
FAQ
Support 24/7
Cabinet
Get premium
Donate
Download
Global statistics library
→
India
→
PNG, bonds (NFL, current US$)
This statistics in other country:
Argentina
Armenia
Botswana
Brazil
Bulgaria
China
Colombia
Costa Rica
Dominican Republic
East Asia & Pacific (excluding high income)
Ecuador
Egypt, Arab Rep.
El Salvador
Europe & Central Asia (excluding high income)
Georgia
Ghana
Guatemala
IDA only
India
Indonesia
Jamaica
Kazakhstan
Lao PDR
Latin America & Caribbean (excluding high income)
Lebanon
Low & middle income
Lower middle income
Malaysia
Mexico
Middle East & North Africa (excluding high income)
Middle income
Mongolia
Nigeria
Pakistan
Panama
Paraguay
Peru
Philippines
Romania
Russian Federation
Serbia
South Africa
South Asia
Sri Lanka
Sub-Saharan Africa (excluding high income)
Thailand
Turkey
Ukraine
Upper middle income
Venezuela, RB
Vietnam
Timeline:
This timeline shows a graph from
1994
to
2016
of India. No data until
1993
. Number of actual observations by date:
23
.
Source name:
World Development Indicators
Source organization:
World Bank, International Debt Statistics.
Categories, topics:
External Debt
Last updated:
apr 23, 2017
Indicators value changes by year
Meaning:
623.762 mln
Minimum:
-3.013 bln
jan 1, 2013
Maximum:
7.384 bln
jan 1, 2008
At the date of observation
Value
Absolute change
Change from the previous value
jan 1, 1994
794.21 mln
+794.21 mln
0.0%
jan 1, 1995
367.341 mln
-426.869 mln
-53.75%
jan 1, 1996
520.0 mln
+152.659 mln
41.56%
jan 1, 1997
784.976 mln
+264.976 mln
50.96%
jan 1, 1998
1.221 bln
+436.233 mln
55.57%
jan 1, 1999
150.79 mln
-1.07 bln
-87.65%
jan 1, 2000
-764.994 mln
-915.784 mln
-607.32%
jan 1, 2001
-35.0 mln
+729.994 mln
-95.42%
jan 1, 2002
-315.949 mln
-280.949 mln
802.71%
jan 1, 2003
-390.295 mln
-74.346 mln
23.53%
jan 1, 2004
-332.272 mln
+58.023 mln
-14.87%
jan 1, 2005
1.98 bln
+2.313 bln
-696.01%
jan 1, 2006
2.803 bln
+822.45 mln
41.53%
jan 1, 2007
4.492 bln
+1.689 bln
60.25%
jan 1, 2008
7.384 bln
+2.892 bln
64.39%
jan 1, 2009
-285.71 mln
-7.669 bln
-103.87%
jan 1, 2010
794.36 mln
+1.08 bln
-378.03%
jan 1, 2011
-562.942 mln
-1.357 bln
-170.87%
jan 1, 2012
-2.11 bln
-1.547 bln
274.84%
jan 1, 2013
-3.013 bln
-903.206 mln
42.8%
jan 1, 2014
390.959 mln
+3.404 bln
-112.97%
jan 1, 2015
-1.529 bln
-1.92 bln
-490.98%
jan 1, 2016
2.003 bln
+3.532 bln
-231.07%
Ranking of countries by current statistics by years
About & Feedback
Terms
Privacy
FAQ
Support 24/7
Cabinet
Get premium
Donate
The service accepts bank transfer (ACH, Wire) or cards (Visa, MasterCard, etc). Processed by Stripe.
Secured with SSL