33
/
AIzaSyB4mHJ5NPEv-XzF7P6NDYXjlkCWaeKw5bc
November 30, 2025
218836
Panama
PAN
true
2
1
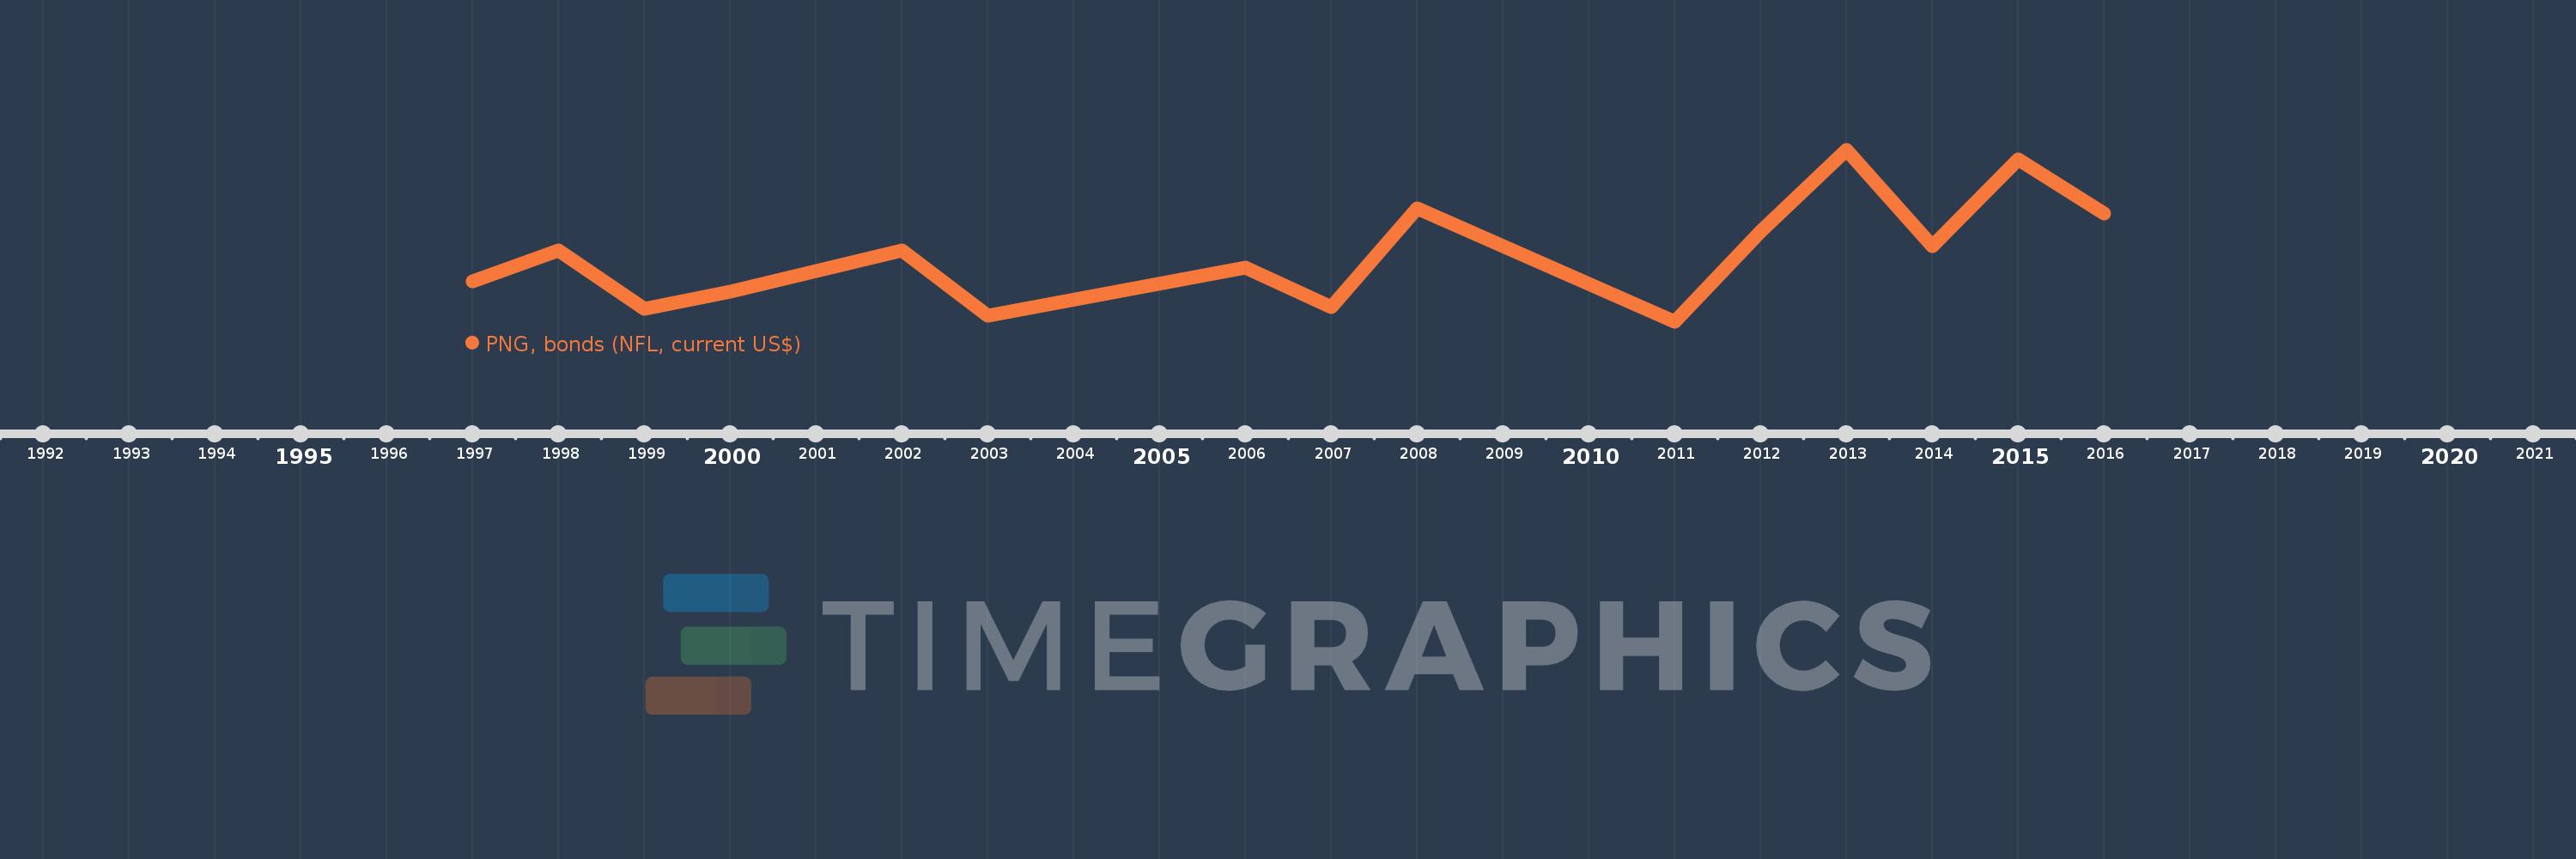
PNG, bonds (NFL, current US$)
2016,2015,2014,2013,2012,2011,2008,2007,2006,2003,2002,2000,1999,1998,1997
Create a timeline
Public Timelines
For education
For educational institutions
For teachers
For students
Cabinet
For educational institutions
For teachers
For students
Open cabinet
FAQ
Close
Create a timeline
Public timelines
FAQ
About & Feedback
Terms
Privacy
FAQ
Support 24/7
Cabinet
Get premium
Donate
Download
Global statistics library
→
Panama
→
PNG, bonds (NFL, current US$)
This statistics in other country:
Argentina
Armenia
Botswana
Brazil
Bulgaria
China
Colombia
Costa Rica
Dominican Republic
East Asia & Pacific (excluding high income)
Ecuador
Egypt, Arab Rep.
El Salvador
Europe & Central Asia (excluding high income)
Georgia
Ghana
Guatemala
IDA only
India
Indonesia
Jamaica
Kazakhstan
Lao PDR
Latin America & Caribbean (excluding high income)
Lebanon
Low & middle income
Lower middle income
Malaysia
Mexico
Middle East & North Africa (excluding high income)
Middle income
Mongolia
Nigeria
Pakistan
Panama
Paraguay
Peru
Philippines
Romania
Russian Federation
Serbia
South Africa
South Asia
Sri Lanka
Sub-Saharan Africa (excluding high income)
Thailand
Turkey
Ukraine
Upper middle income
Venezuela, RB
Vietnam
Timeline:
This timeline shows a graph from
1997
to
2016
of Panama. No data until
1996
. Number of actual observations by date:
15
.
Source name:
World Development Indicators
Source organization:
World Bank, International Debt Statistics.
Categories, topics:
External Debt
Last updated:
apr 23, 2017
Indicators value changes by year
Meaning:
228.495 mln
Minimum:
-150.0 mln
jan 1, 2011
Maximum:
800.0 mln
jan 1, 2013
At the date of observation
Value
Absolute change
Change from the previous value
jan 1, 1997
75.0 mln
+75.0 mln
0.0%
jan 1, 1998
246.0 mln
+171.0 mln
228.0%
jan 1, 1999
-75.0 mln
-321.0 mln
-130.49%
jan 1, 2000
20.0 mln
+95.0 mln
-126.67%
jan 1, 2002
246.745 mln
+226.745 mln
1.13K%
jan 1, 2003
-115.0 mln
-361.745 mln
-146.61%
jan 1, 2006
150.0 mln
+265.0 mln
-230.43%
jan 1, 2007
-69.078 mln
-219.078 mln
-146.05%
jan 1, 2008
479.989 mln
+549.067 mln
-794.85%
jan 1, 2011
-150.0 mln
-629.989 mln
-131.25%
jan 1, 2012
350.0 mln
+500.0 mln
-333.33%
jan 1, 2013
800.0 mln
+450.0 mln
128.57%
jan 1, 2014
270.0 mln
-530.0 mln
-66.25%
jan 1, 2015
748.766 mln
+478.766 mln
177.32%
jan 1, 2016
450.0 mln
-298.766 mln
-39.9%
Ranking of countries by current statistics by years
About & Feedback
Terms
Privacy
FAQ
Support 24/7
Cabinet
Get premium
Donate
The service accepts bank transfer (ACH, Wire) or cards (Visa, MasterCard, etc). Processed by Stripe.
Secured with SSL