33
/
AIzaSyB4mHJ5NPEv-XzF7P6NDYXjlkCWaeKw5bc
November 30, 2025
224074
Philippines
PHL
true
2
1
PNG, bonds (NFL, current US$)
2016,2015,2014,2013,2012,2011,2010,2009,2008,2007,2006,2005,2004,2003,2002,2001,2000,1999,1998,1997,1996,1995,1994,1993
Create a timeline
Public Timelines
For education
For educational institutions
For teachers
For students
Cabinet
For educational institutions
For teachers
For students
Open cabinet
FAQ
Close
Create a timeline
Public timelines
FAQ
About & Feedback
Terms
Privacy
FAQ
Support 24/7
Cabinet
Get premium
Donate
Download
Global statistics library
→
Philippines
→
PNG, bonds (NFL, current US$)
This statistics in other country:
Argentina
Armenia
Botswana
Brazil
Bulgaria
China
Colombia
Costa Rica
Dominican Republic
East Asia & Pacific (excluding high income)
Ecuador
Egypt, Arab Rep.
El Salvador
Europe & Central Asia (excluding high income)
Georgia
Ghana
Guatemala
IDA only
India
Indonesia
Jamaica
Kazakhstan
Lao PDR
Latin America & Caribbean (excluding high income)
Lebanon
Low & middle income
Lower middle income
Malaysia
Mexico
Middle East & North Africa (excluding high income)
Middle income
Mongolia
Nigeria
Pakistan
Panama
Paraguay
Peru
Philippines
Romania
Russian Federation
Serbia
South Africa
South Asia
Sri Lanka
Sub-Saharan Africa (excluding high income)
Thailand
Turkey
Ukraine
Upper middle income
Venezuela, RB
Vietnam
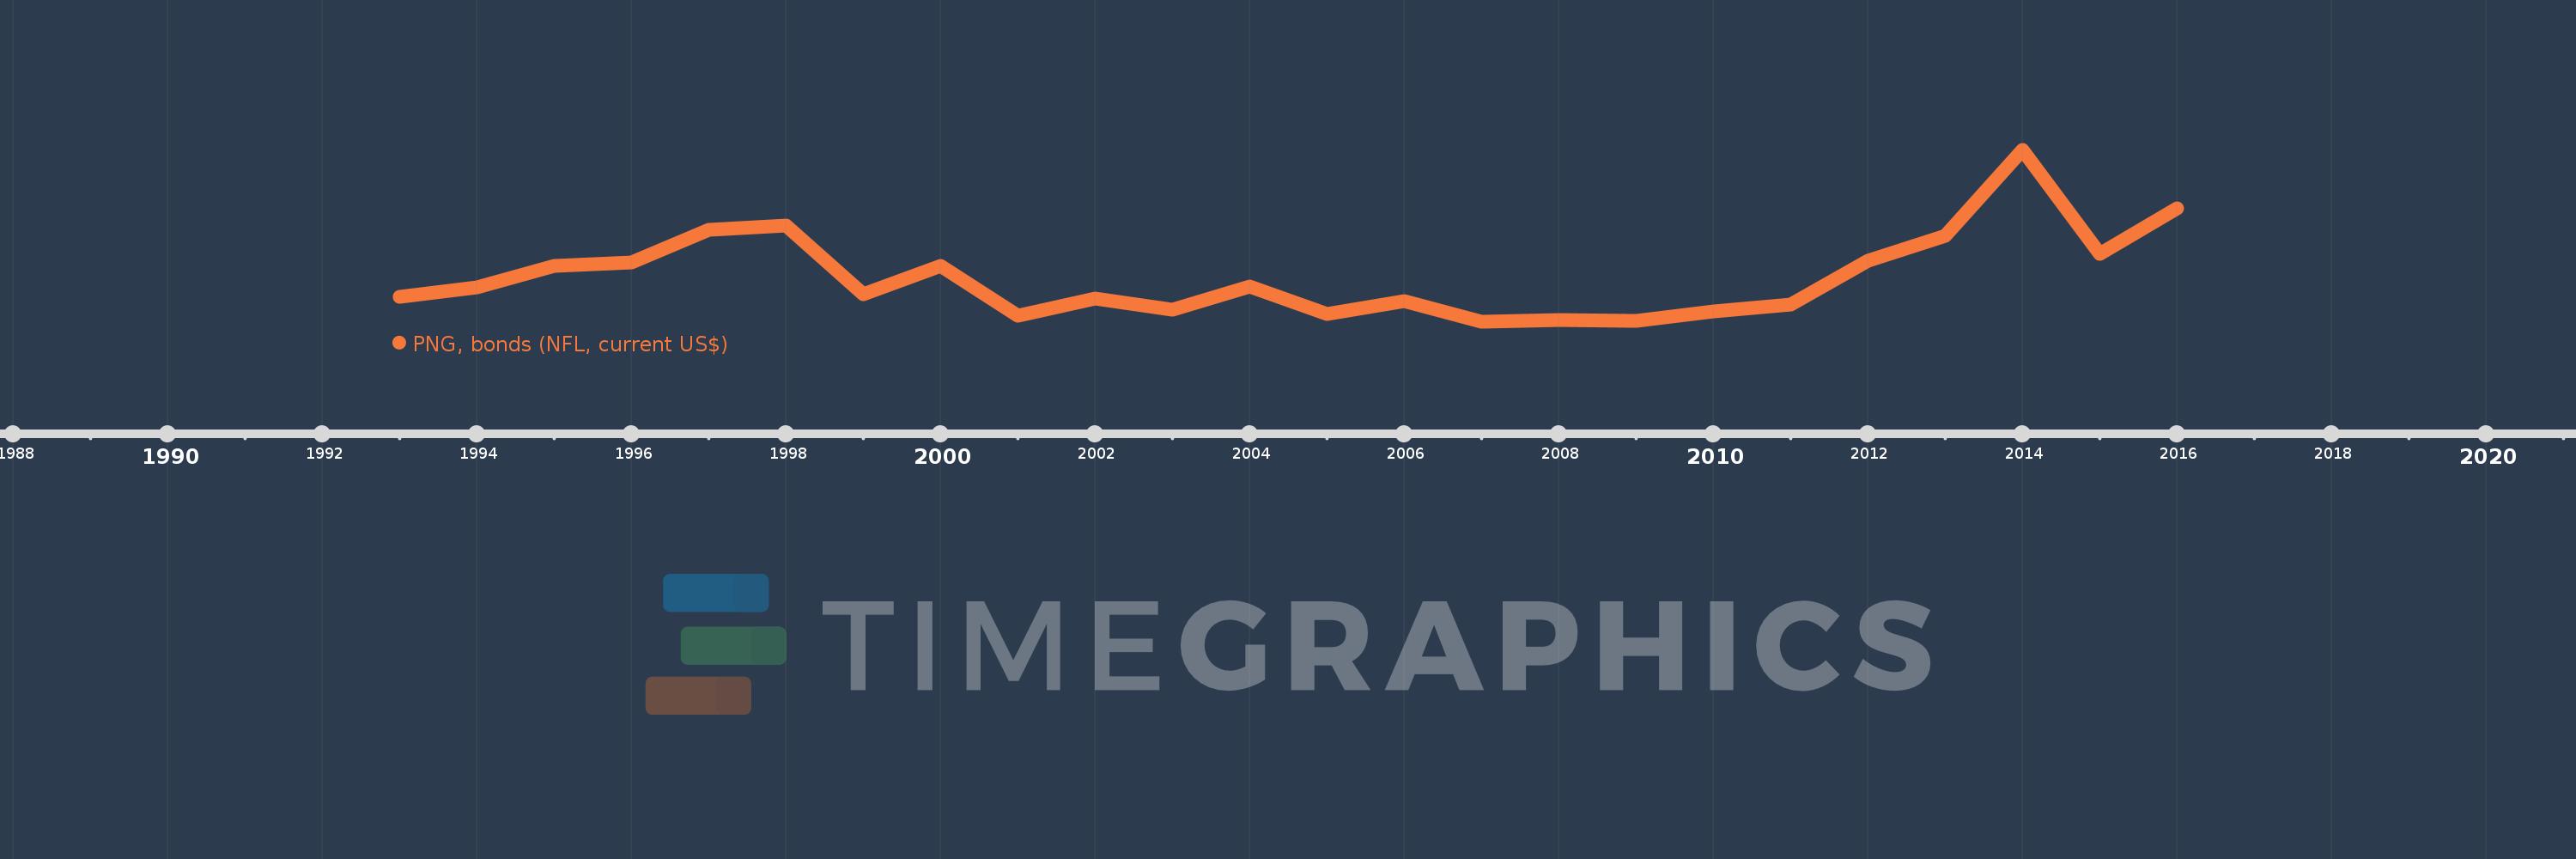
Timeline:
This timeline shows a graph from
1993
to
2016
of Philippines. No data until
1992
. Number of actual observations by date:
24
.
Source name:
World Development Indicators
Source organization:
World Bank, International Debt Statistics.
Categories, topics:
External Debt
Last updated:
apr 23, 2017
Indicators value changes by year
Meaning:
517.381 mln
Minimum:
-603.608 mln
jan 1, 2007
Maximum:
3.65 bln
jan 1, 2014
At the date of observation
Value
Absolute change
Change from the previous value
jan 1, 1993
20.0 mln
+20.0 mln
0.0%
jan 1, 1994
251.197 mln
+231.197 mln
1.16K%
jan 1, 1995
784.494 mln
+533.297 mln
212.3%
jan 1, 1996
863.5 mln
+79.006 mln
10.07%
jan 1, 1997
1.678 bln
+814.5 mln
94.33%
jan 1, 1998
1.793 bln
+115.0 mln
6.85%
jan 1, 1999
90.0 mln
-1.703 bln
-94.98%
jan 1, 2000
775.0 mln
+685.0 mln
761.11%
jan 1, 2001
-439.786 mln
-1.215 bln
-156.75%
jan 1, 2002
-17.729 mln
+422.057 mln
-95.97%
jan 1, 2003
-300.349 mln
-282.62 mln
1.59K%
jan 1, 2004
264.501 mln
+564.85 mln
-188.06%
jan 1, 2005
-395.295 mln
-659.796 mln
-249.45%
jan 1, 2006
-83.061 mln
+312.234 mln
-78.99%
jan 1, 2007
-603.608 mln
-520.547 mln
626.7%
jan 1, 2008
-557.938 mln
+45.67 mln
-7.57%
jan 1, 2009
-571.857 mln
-13.919 mln
2.49%
jan 1, 2010
-338.856 mln
+233.001 mln
-40.74%
jan 1, 2011
-173.824 mln
+165.032 mln
-48.7%
jan 1, 2012
917.259 mln
+1.091 bln
-627.69%
jan 1, 2013
1.525 bln
+607.741 mln
66.26%
jan 1, 2014
3.65 bln
+2.125 bln
139.34%
jan 1, 2015
1.075 bln
-2.575 bln
-70.55%
jan 1, 2016
2.212 bln
+1.137 bln
105.81%
Ranking of countries by current statistics by years
About & Feedback
Terms
Privacy
FAQ
Support 24/7
Cabinet
Get premium
Donate
The service accepts bank transfer (ACH, Wire) or cards (Visa, MasterCard, etc). Processed by Stripe.
Secured with SSL