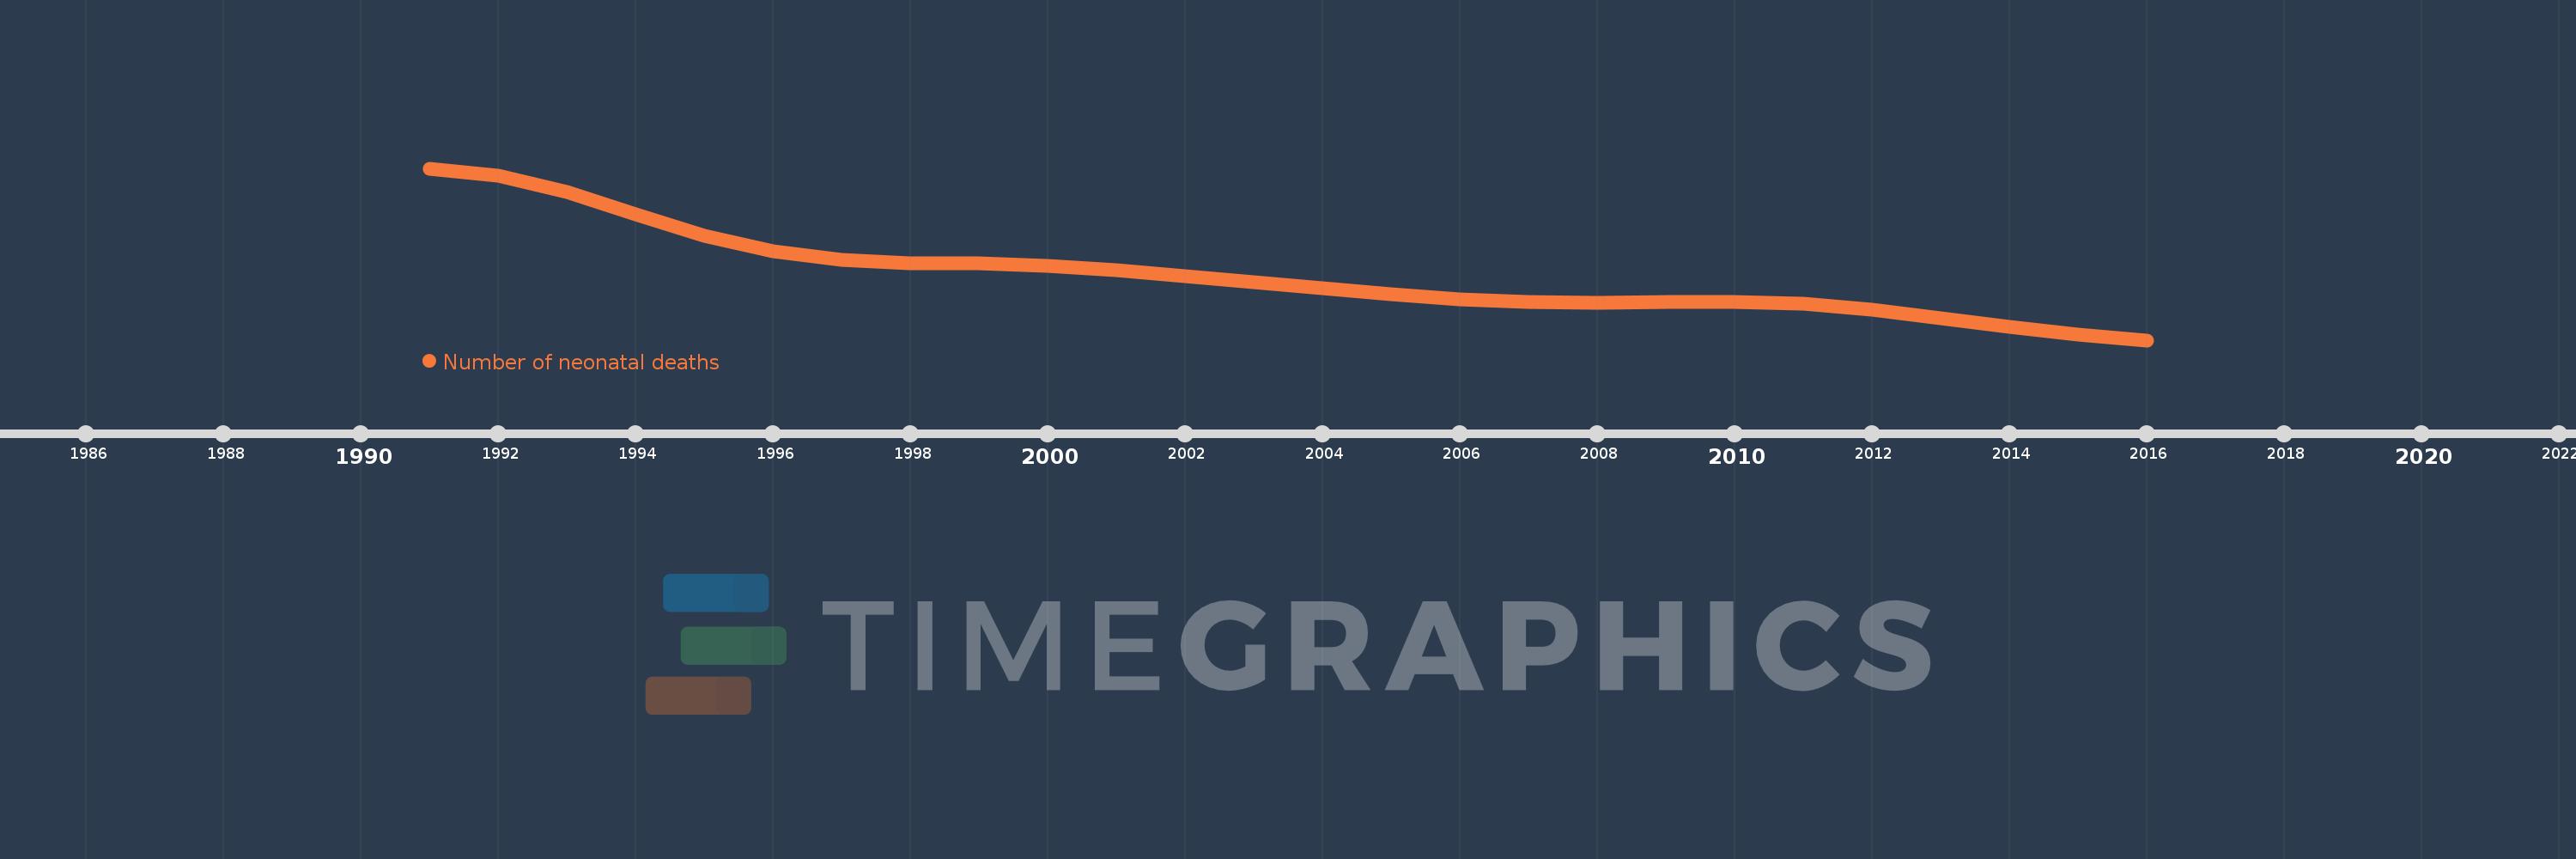
This timeline shows a graph from 1991 to 2016 of Bulgaria. No data until 1990. Number of actual observations by date: 26.
Source name:
World Development Indicators
Source organization:
Estimates developed by the UN Inter-agency Group for Child Mortality Estimation (UNICEF, WHO, World Bank, UN DESA Population Division) at www.childmortality.org.
Categories, topics:
Health
Last updated:
apr 23, 2017
Indicators value changes by year
Meaning:
721.115
Minimum:
335.0
jan 1, 2016
Maximum:
1.348K
jan 1, 1991
At the date of observation
Value
Absolute change
Change from the previous value
jan 1, 1991
1.348K
+1.348K
0.0%
jan 1, 1992
1.305K
-43.0
-3.19%
jan 1, 1993
1.208K
-97.0
-7.43%
jan 1, 1994
1.079K
-129.0
-10.68%
jan 1, 1995
951.0
-128.0
-11.86%
jan 1, 1996
858.0
-93.0
-9.78%
jan 1, 1997
810.0
-48.0
-5.59%
jan 1, 1998
790.0
-20.0
-2.47%
jan 1, 1999
788.0
-2.0
-0.25%
jan 1, 2000
774.0
-14.0
-1.78%
jan 1, 2001
748.0
-26.0
-3.36%
jan 1, 2002
714.0
-34.0
-4.55%
jan 1, 2003
677.0
-37.0
-5.18%
jan 1, 2004
641.0
-36.0
-5.32%
jan 1, 2005
604.0
-37.0
-5.77%
jan 1, 2006
575.0
-29.0
-4.8%
jan 1, 2007
560.0
-15.0
-2.61%
jan 1, 2008
557.0
-3.0
-0.54%
jan 1, 2009
559.0
+2.0
0.36%
jan 1, 2010
559.0
0.0
0.0%
jan 1, 2011
552.0
-7.0
-1.25%
jan 1, 2012
514.0
-38.0
-6.88%
jan 1, 2013
464.0
-50.0
-9.73%
jan 1, 2014
412.0
-52.0
-11.21%
jan 1, 2015
367.0
-45.0
-10.92%
jan 1, 2016
335.0
-32.0
-8.72%
Ranking of countries by current statistics by years