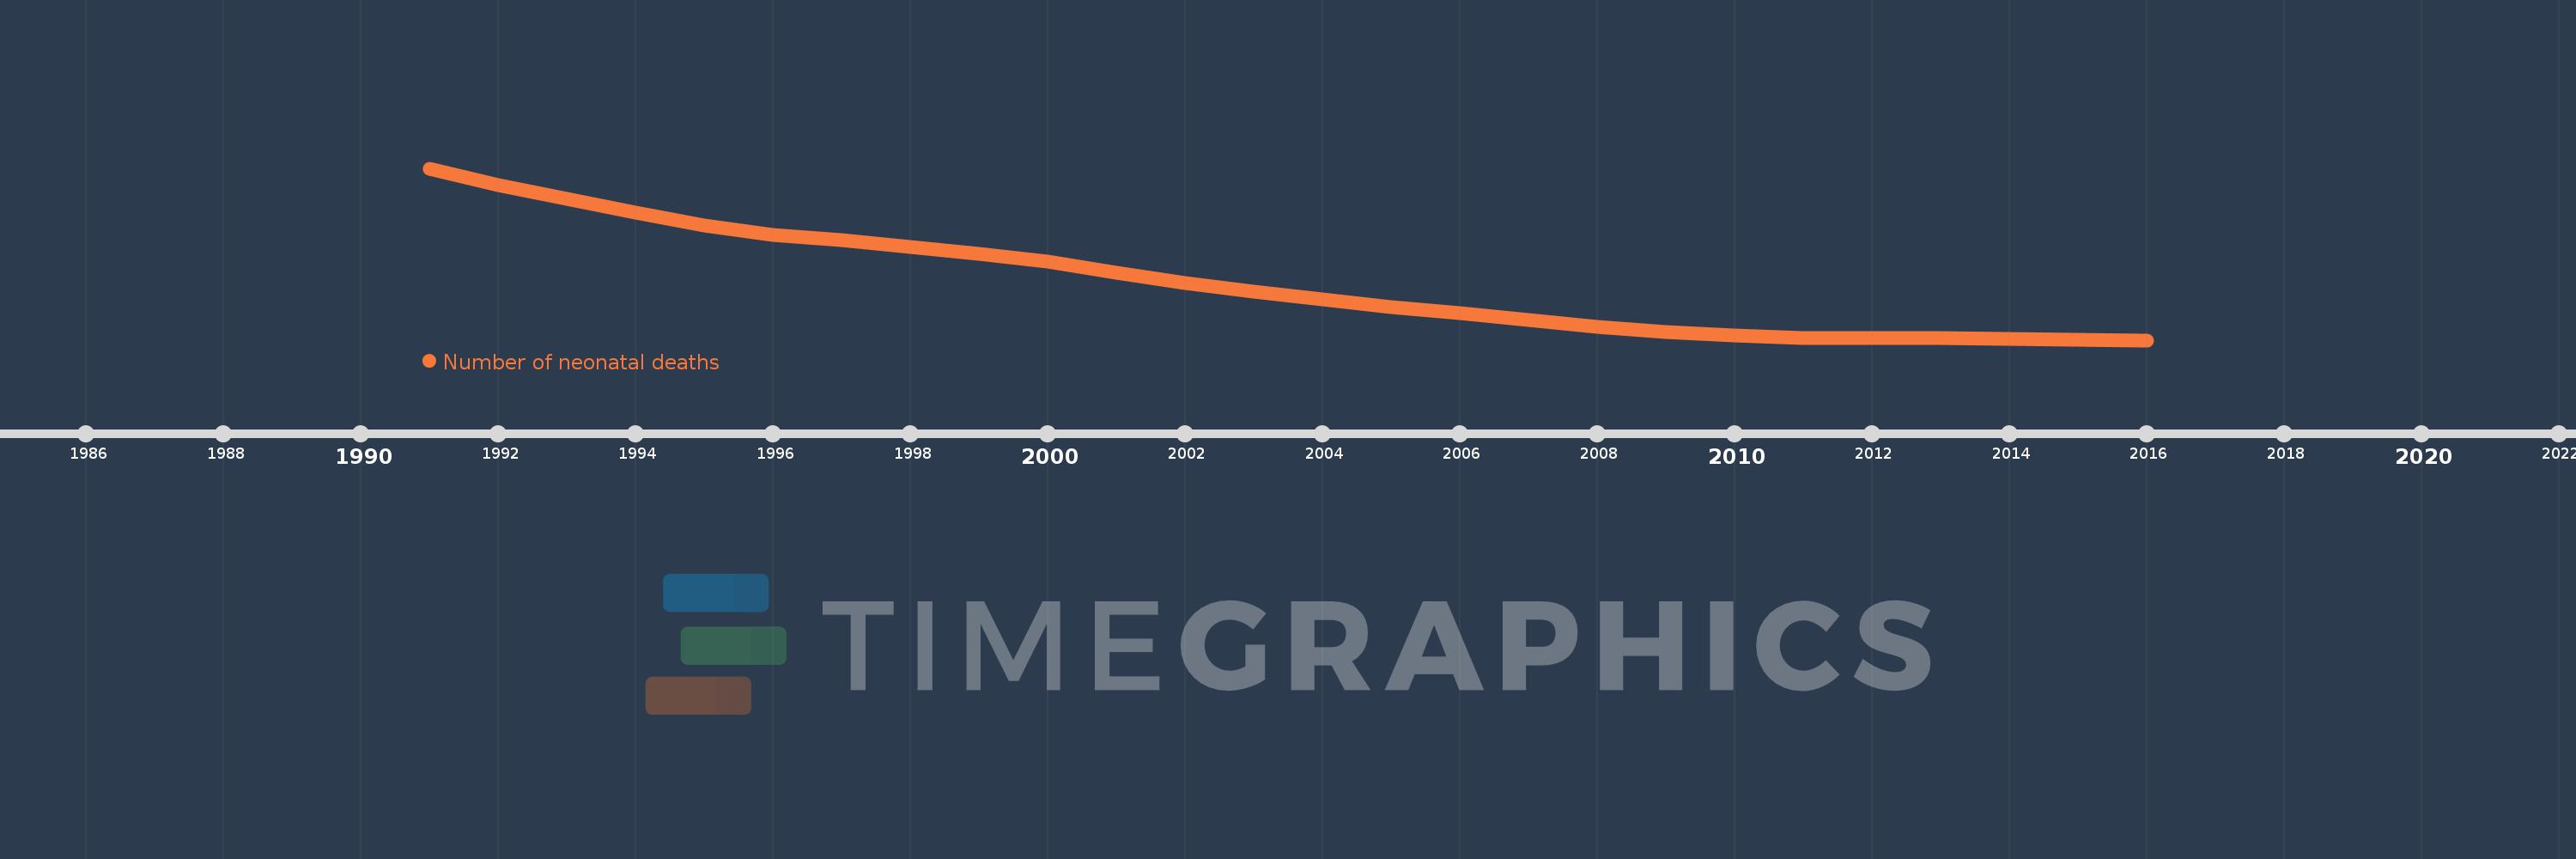
This timeline shows a graph from 1991 to 2016 of Belarus. No data until 1990. Number of actual observations by date: 26.
Source name:
World Development Indicators
Source organization:
Estimates developed by the UN Inter-agency Group for Child Mortality Estimation (UNICEF, WHO, World Bank, UN DESA Population Division) at www.childmortality.org.
Categories, topics:
Health
Last updated:
apr 23, 2017
Indicators value changes by year
Meaning:
619.0
Minimum:
239.0
jan 1, 2016
Maximum:
1.37K
jan 1, 1991
At the date of observation
Value
Absolute change
Change from the previous value
jan 1, 1991
1.37K
+1.37K
0.0%
jan 1, 1992
1.261K
-109.0
-7.96%
jan 1, 1993
1.167K
-94.0
-7.45%
jan 1, 1994
1.081K
-86.0
-7.37%
jan 1, 1995
994.0
-87.0
-8.05%
jan 1, 1996
930.0
-64.0
-6.44%
jan 1, 1997
896.0
-34.0
-3.66%
jan 1, 1998
851.0
-45.0
-5.02%
jan 1, 1999
808.0
-43.0
-5.05%
jan 1, 2000
755.0
-53.0
-6.56%
jan 1, 2001
681.0
-74.0
-9.8%
jan 1, 2002
615.0
-66.0
-9.69%
jan 1, 2003
557.0
-58.0
-9.43%
jan 1, 2004
508.0
-49.0
-8.8%
jan 1, 2005
457.0
-51.0
-10.04%
jan 1, 2006
417.0
-40.0
-8.75%
jan 1, 2007
373.0
-44.0
-10.55%
jan 1, 2008
328.0
-45.0
-12.06%
jan 1, 2009
293.0
-35.0
-10.67%
jan 1, 2010
268.0
-25.0
-8.53%
jan 1, 2011
254.0
-14.0
-5.22%
jan 1, 2012
252.0
-2.0
-0.79%
jan 1, 2013
251.0
-1.0
-0.4%
jan 1, 2014
248.0
-3.0
-1.2%
jan 1, 2015
240.0
-8.0
-3.23%
jan 1, 2016
239.0
-1.0
-0.42%
Ranking of countries by current statistics by years