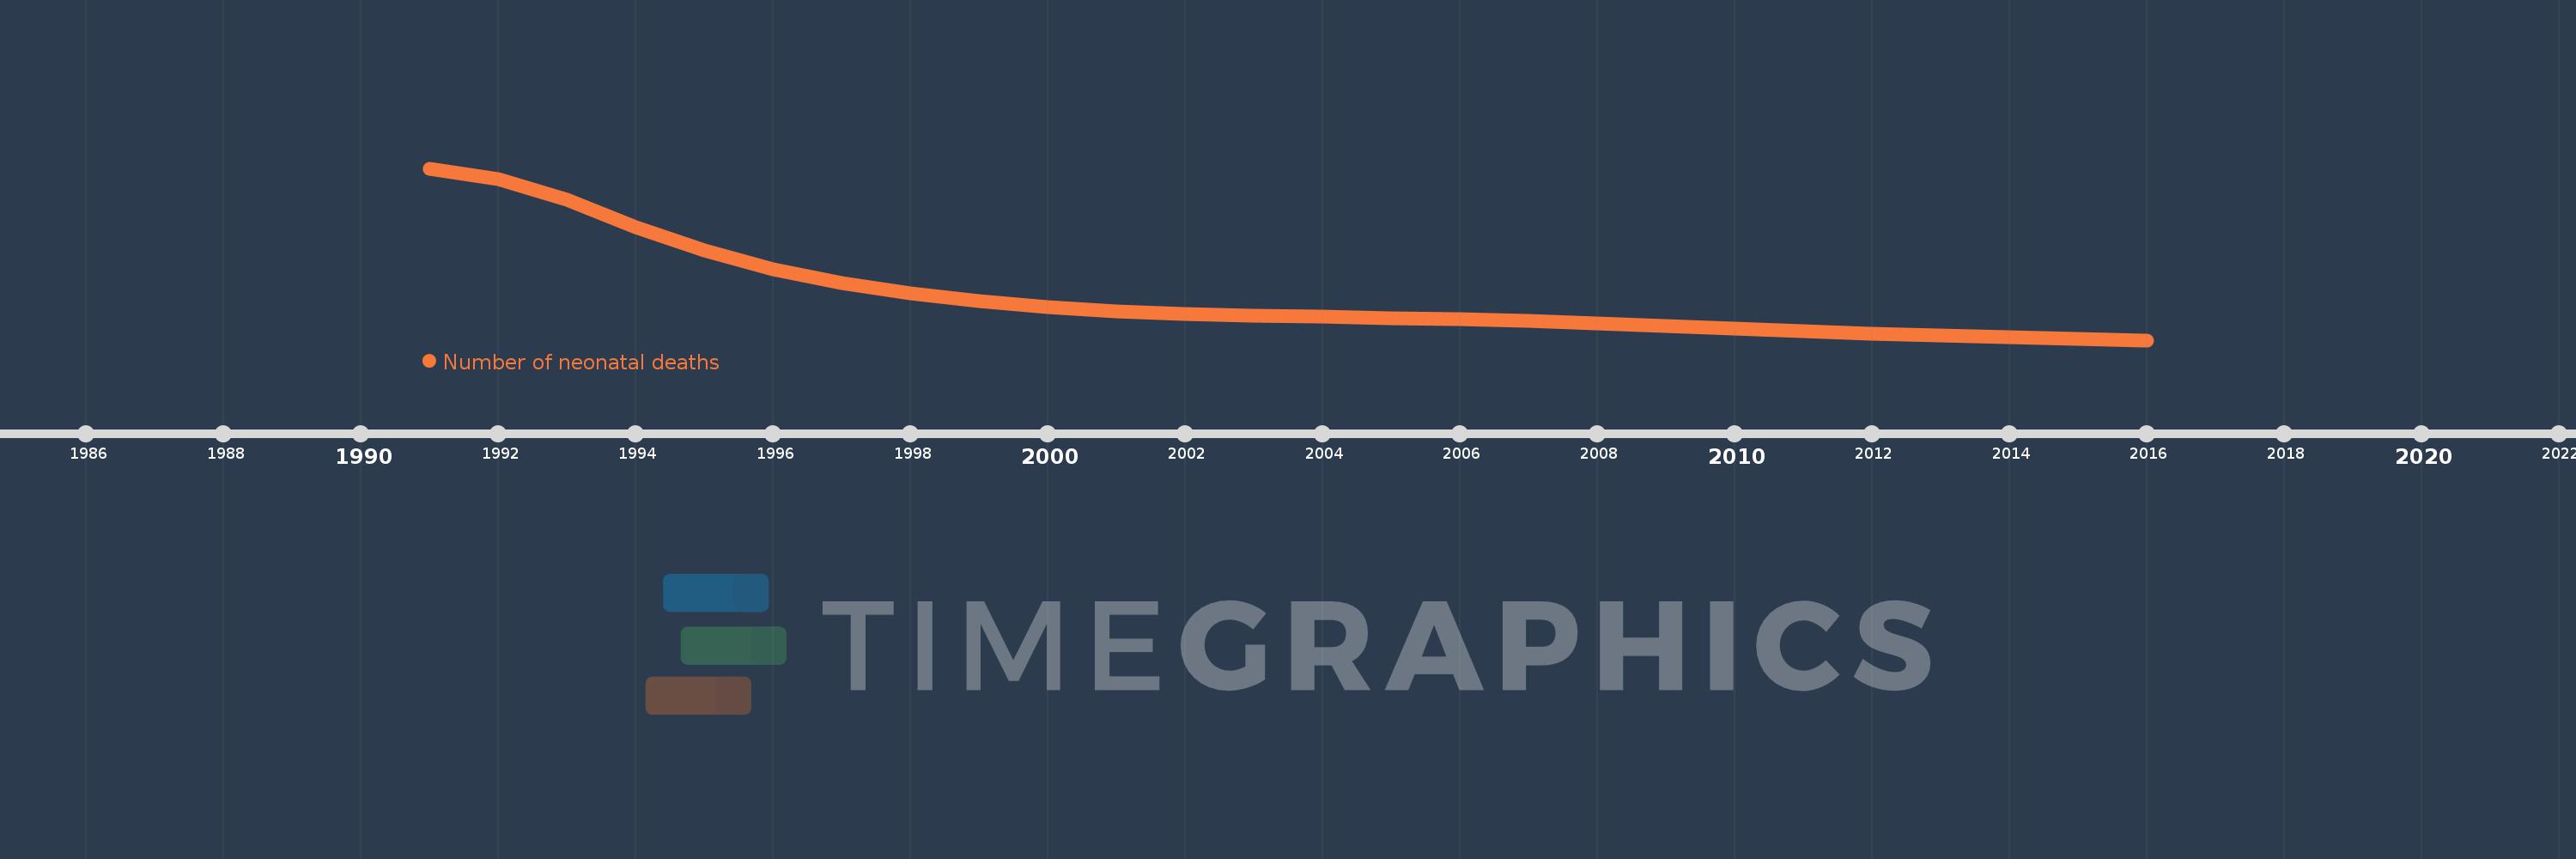
This timeline shows a graph from 1991 to 2016 of Hungary. No data until 1990. Number of actual observations by date: 26.
Source name:
World Development Indicators
Source organization:
Estimates developed by the UN Inter-agency Group for Child Mortality Estimation (UNICEF, WHO, World Bank, UN DESA Population Division) at www.childmortality.org.
Categories, topics:
Health
Last updated:
apr 23, 2017
Indicators value changes by year
Meaning:
758.115
Minimum:
304.0
jan 1, 2016
Maximum:
2.06K
jan 1, 1991
At the date of observation
Value
Absolute change
Change from the previous value
jan 1, 1991
2.06K
+2.06K
0.0%
jan 1, 1992
1.948K
-112.0
-5.44%
jan 1, 1993
1.739K
-209.0
-10.73%
jan 1, 1994
1.461K
-278.0
-15.99%
jan 1, 1995
1.22K
-241.0
-16.5%
jan 1, 1996
1.026K
-194.0
-15.9%
jan 1, 1997
885.0
-141.0
-13.74%
jan 1, 1998
784.0
-101.0
-11.41%
jan 1, 1999
701.0
-83.0
-10.59%
jan 1, 2000
646.0
-55.0
-7.85%
jan 1, 2001
601.0
-45.0
-6.97%
jan 1, 2002
574.0
-27.0
-4.49%
jan 1, 2003
552.0
-22.0
-3.83%
jan 1, 2004
543.0
-9.0
-1.63%
jan 1, 2005
529.0
-14.0
-2.58%
jan 1, 2006
515.0
-14.0
-2.65%
jan 1, 2007
500.0
-15.0
-2.91%
jan 1, 2008
479.0
-21.0
-4.2%
jan 1, 2009
452.0
-27.0
-5.64%
jan 1, 2010
423.0
-29.0
-6.42%
jan 1, 2011
393.0
-30.0
-7.09%
jan 1, 2012
374.0
-19.0
-4.83%
jan 1, 2013
353.0
-21.0
-5.61%
jan 1, 2014
333.0
-20.0
-5.67%
jan 1, 2015
316.0
-17.0
-5.11%
jan 1, 2016
304.0
-12.0
-3.8%
Ranking of countries by current statistics by years