29
/
en
AIzaSyAYiBZKx7MnpbEhh9jyipgxe19OcubqV5w
April 1, 2024
148336
Guyana
GUY
true
2
1
Number of neonatal deaths
2016,2015,2014,2013,2012,2011,2010,2009,2008,2007,2006,2005,2004,2003,2002,2001,2000,1999,1998,1997,1996,1995,1994,1993,1992,1991
This statistics in other country:
AfghanistanAlbaniaAlgeriaAndorraAngolaAntigua and BarbudaArgentinaArmeniaAustraliaAustriaAzerbaijanBahamas, TheBahrainBangladeshBarbadosBelarusBelgiumBelizeBeninBhutanBoliviaBosnia and HerzegovinaBotswanaBrazilBrunei DarussalamBulgariaBurkina FasoBurundiCabo VerdeCambodiaCameroonCanadaCentral African RepublicChadChileChinaColombiaComorosCongo, Dem. Rep.Congo, Rep.Costa RicaCote d'IvoireCroatiaCubaCyprusCzech RepublicDenmarkDjiboutiDominicaDominican RepublicEast Asia & Pacific (excluding high income)EcuadorEgypt, Arab Rep.El SalvadorEquatorial GuineaEritreaEstoniaEthiopiaEurope & Central Asia (excluding high income)FijiFinlandFranceGabonGambia, TheGeorgiaGermanyGhanaGreeceGrenadaGuatemalaGuineaGuinea-BissauGuyanaHaitiHigh incomeHondurasHungaryIcelandIndiaIndonesiaIran, Islamic Rep.IraqIrelandIsraelItalyJamaicaJapanJordanKazakhstanKenyaKiribatiKorea, Dem. People’s Rep.Korea, Rep.KuwaitKyrgyz RepublicLao PDRLatin America & Caribbean (excluding high income)LatviaLebanonLesothoLiberiaLibyaLithuaniaLow & middle incomeLow incomeLower middle incomeLuxembourgMacedonia, FYRMadagascarMalawiMalaysiaMaldivesMaliMaltaMarshall IslandsMauritaniaMauritiusMexicoMicronesia, Fed. Sts.Middle East & North Africa (excluding high income)Middle incomeMoldovaMonacoMongoliaMontenegroMoroccoMozambiqueMyanmarNamibiaNauruNepalNetherlandsNew ZealandNicaraguaNigerNigeriaNorwayOmanPakistanPalauPanamaPapua New GuineaParaguayPeruPhilippinesPolandPortugalQatarRomaniaRussian FederationRwandaSamoaSan MarinoSao Tome and PrincipeSaudi ArabiaSenegalSerbiaSeychellesSierra LeoneSingaporeSlovak RepublicSloveniaSolomon IslandsSomaliaSouth AfricaSouth AsiaSouth SudanSpainSri LankaSt. Kitts and NevisSt. LuciaSt. Vincent and the GrenadinesSub-Saharan Africa (excluding high income)SudanSurinameSwazilandSwedenSwitzerlandSyrian Arab RepublicTajikistanTanzaniaThailandTimor-LesteTogoTongaTrinidad and TobagoTunisiaTurkeyTurkmenistanTuvaluUgandaUkraineUnited Arab EmiratesUnited KingdomUnited StatesUpper middle incomeUruguayUzbekistanVanuatuVenezuela, RBVietnamWest Bank and GazaWorldYemen, Rep.ZambiaZimbabwe Timeline:
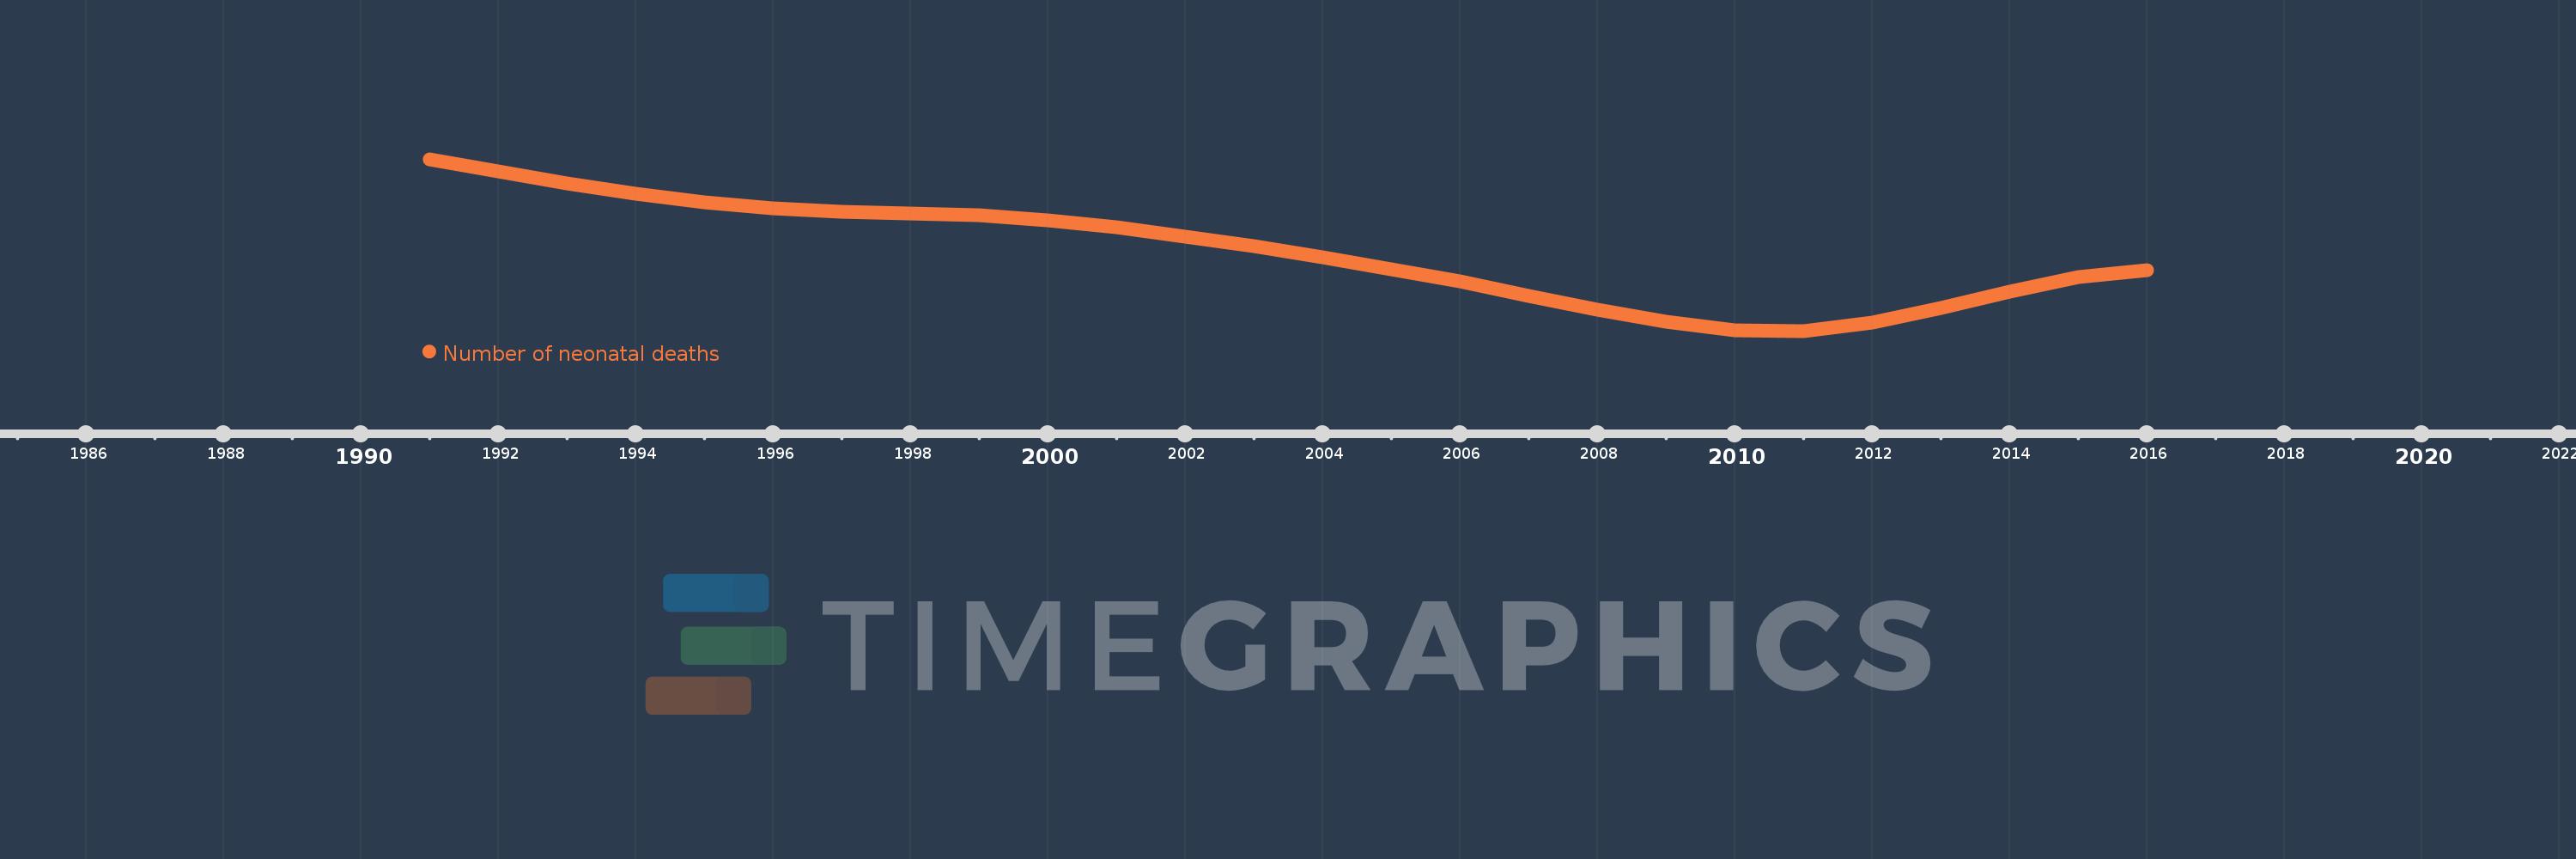
This timeline shows a graph from 1991 to 2016 of Guyana. No data until 1990. Number of actual observations by date: 26.
Source name:
World Development Indicators
Source organization:
Estimates developed by the UN Inter-agency Group for Child Mortality Estimation (UNICEF, WHO, World Bank, UN DESA Population Division) at www.childmortality.org.
Categories, topics:
Health
Last updated:
apr 23, 2017
Indicators value changes by year
At the date of observation
Value
Absolute change
Change from previous value
jan 1, 1991
630.0
+630.0
0.0%
jan 1, 1992
603.0
-27.0
-4.29%
jan 1, 1993
578.0
-25.0
-4.15%
jan 1, 1994
556.0
-22.0
-3.81%
jan 1, 1995
538.0
-18.0
-3.24%
jan 1, 1996
524.0
-14.0
-2.6%
jan 1, 1997
517.0
-7.0
-1.34%
jan 1, 1998
514.0
-3.0
-0.58%
jan 1, 1999
509.0
-5.0
-0.97%
jan 1, 2000
498.0
-11.0
-2.16%
jan 1, 2001
483.0
-15.0
-3.01%
jan 1, 2002
464.0
-19.0
-3.93%
jan 1, 2003
443.0
-21.0
-4.53%
jan 1, 2004
419.0
-24.0
-5.42%
jan 1, 2005
394.0
-25.0
-5.97%
jan 1, 2006
368.0
-26.0
-6.6%
jan 1, 2007
337.0
-31.0
-8.42%
jan 1, 2008
306.0
-31.0
-9.2%
jan 1, 2009
280.0
-26.0
-8.5%
jan 1, 2010
263.0
-17.0
-6.07%
jan 1, 2011
261.0
-2.0
-0.76%
jan 1, 2012
278.0
+17.0
6.51%
jan 1, 2013
310.0
+32.0
11.51%
jan 1, 2014
346.0
+36.0
11.61%
jan 1, 2015
376.0
+30.0
8.67%
jan 1, 2016
391.0
+15.0
3.99%
Ranking of countries by current statistics by years
Comments: