29
/
en
AIzaSyAYiBZKx7MnpbEhh9jyipgxe19OcubqV5w
April 1, 2024
196890
Micronesia, Fed. Sts.
FSM
true
2
1
Number of neonatal deaths
2016,2015,2014,2013,2012,2011,2010,2009,2008,2007,2006,2005,2004,2003,2002,2001,2000,1999,1998,1997,1996,1995,1994,1993,1992,1991
Download
Global statistics library →Micronesia, Fed. Sts. →

Number of neonatal deaths

This statistics in other country:
AfghanistanAlbaniaAlgeriaAndorraAngolaAntigua and BarbudaArgentinaArmeniaAustraliaAustriaAzerbaijanBahamas, TheBahrainBangladeshBarbadosBelarusBelgiumBelizeBeninBhutanBoliviaBosnia and HerzegovinaBotswanaBrazilBrunei DarussalamBulgariaBurkina FasoBurundiCabo VerdeCambodiaCameroonCanadaCentral African RepublicChadChileChinaColombiaComorosCongo, Dem. Rep.Congo, Rep.Costa RicaCote d'IvoireCroatiaCubaCyprusCzech RepublicDenmarkDjiboutiDominicaDominican RepublicEast Asia & Pacific (excluding high income)EcuadorEgypt, Arab Rep.El SalvadorEquatorial GuineaEritreaEstoniaEthiopiaEurope & Central Asia (excluding high income)FijiFinlandFranceGabonGambia, TheGeorgiaGermanyGhanaGreeceGrenadaGuatemalaGuineaGuinea-BissauGuyanaHaitiHigh incomeHondurasHungaryIcelandIndiaIndonesiaIran, Islamic Rep.IraqIrelandIsraelItalyJamaicaJapanJordanKazakhstanKenyaKiribatiKorea, Dem. People’s Rep.Korea, Rep.KuwaitKyrgyz RepublicLao PDRLatin America & Caribbean (excluding high income)LatviaLebanonLesothoLiberiaLibyaLithuaniaLow & middle incomeLow incomeLower middle incomeLuxembourgMacedonia, FYRMadagascarMalawiMalaysiaMaldivesMaliMaltaMarshall IslandsMauritaniaMauritiusMexicoMicronesia, Fed. Sts.Middle East & North Africa (excluding high income)Middle incomeMoldovaMonacoMongoliaMontenegroMoroccoMozambiqueMyanmarNamibiaNauruNepalNetherlandsNew ZealandNicaraguaNigerNigeriaNorwayOmanPakistanPalauPanamaPapua New GuineaParaguayPeruPhilippinesPolandPortugalQatarRomaniaRussian FederationRwandaSamoaSan MarinoSao Tome and PrincipeSaudi ArabiaSenegalSerbiaSeychellesSierra LeoneSingaporeSlovak RepublicSloveniaSolomon IslandsSomaliaSouth AfricaSouth AsiaSouth SudanSpainSri LankaSt. Kitts and NevisSt. LuciaSt. Vincent and the GrenadinesSub-Saharan Africa (excluding high income)SudanSurinameSwazilandSwedenSwitzerlandSyrian Arab RepublicTajikistanTanzaniaThailandTimor-LesteTogoTongaTrinidad and TobagoTunisiaTurkeyTurkmenistanTuvaluUgandaUkraineUnited Arab EmiratesUnited KingdomUnited StatesUpper middle incomeUruguayUzbekistanVanuatuVenezuela, RBVietnamWest Bank and GazaWorldYemen, Rep.ZambiaZimbabwe
Timeline:
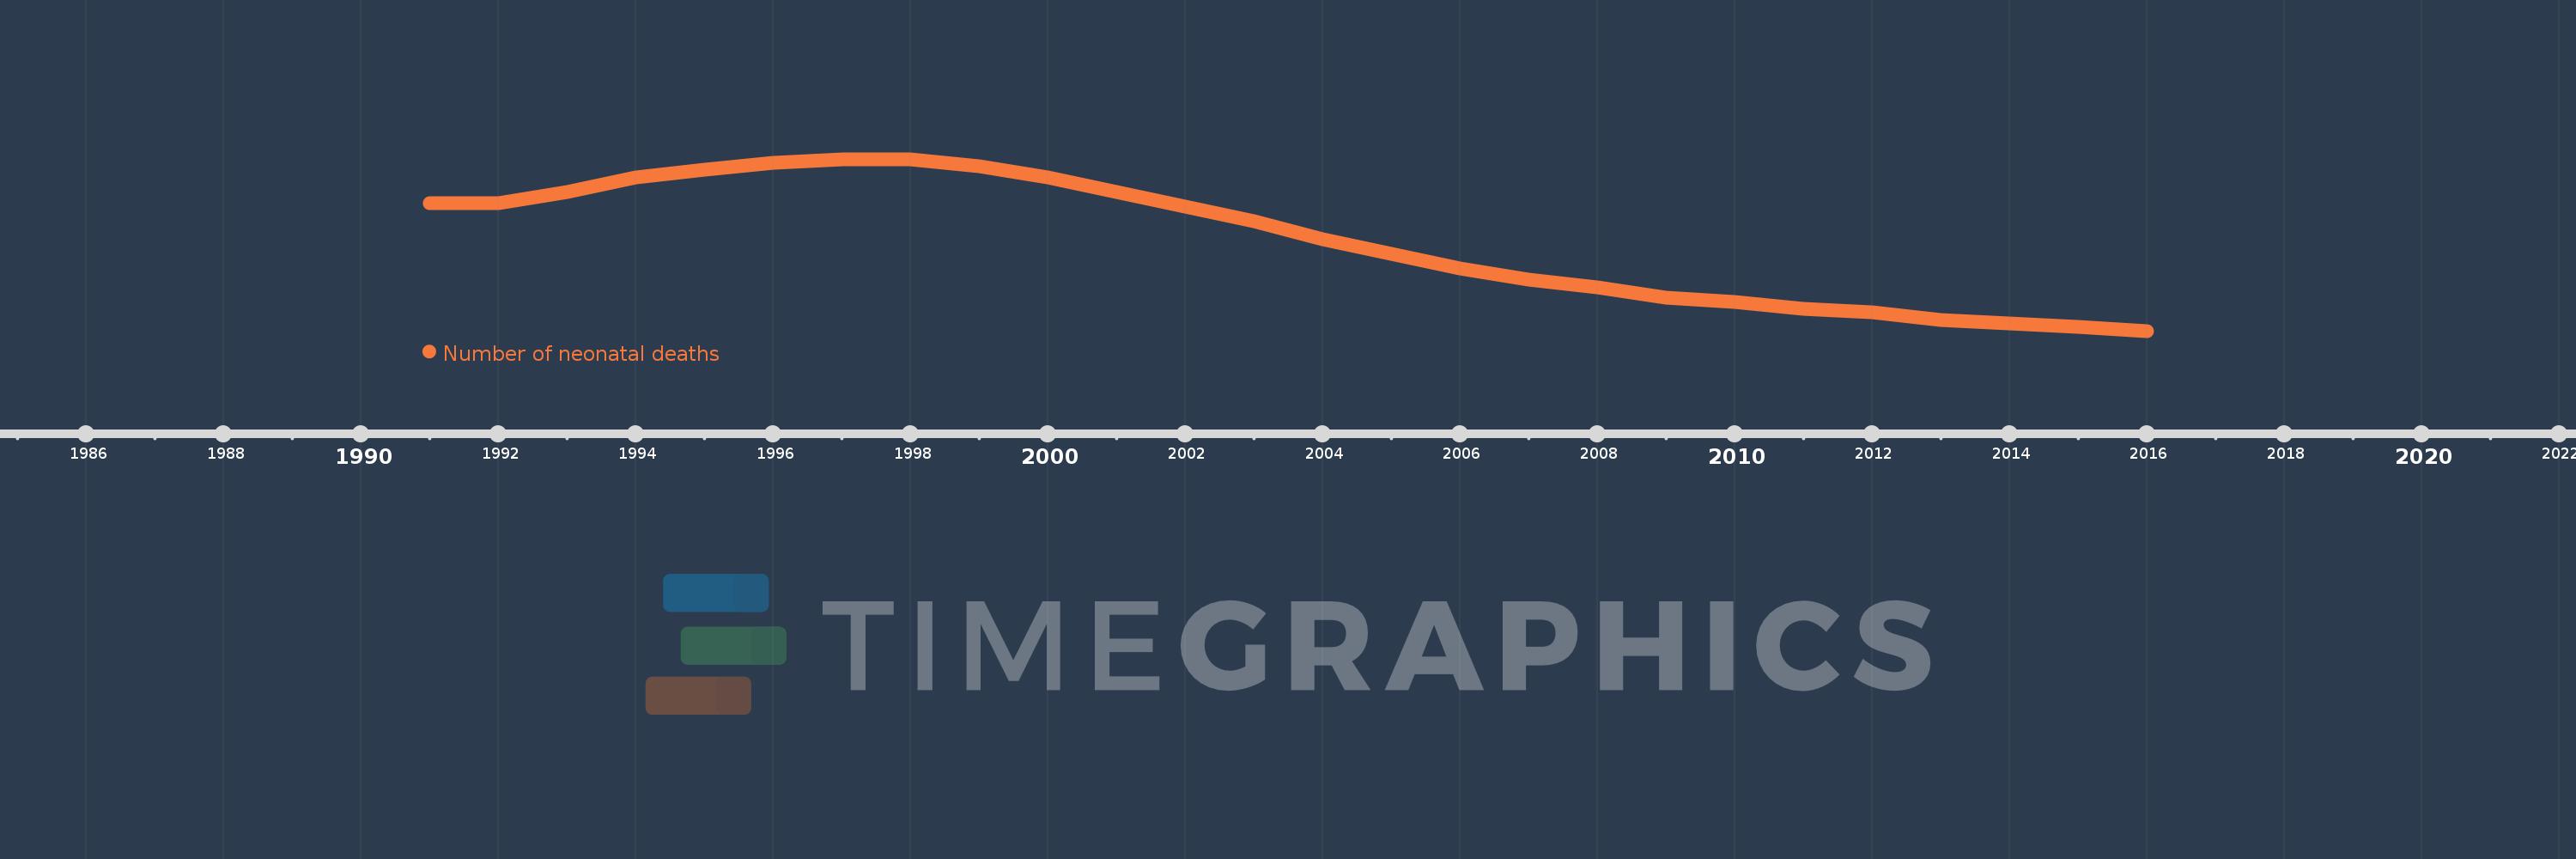
This timeline shows a graph from 1991 to 2016 of Micronesia, Fed. Sts.. No data until 1990. Number of actual observations by date: 26.
Source name:
World Development Indicators
Source organization:
Estimates developed by the UN Inter-agency Group for Child Mortality Estimation (UNICEF, WHO, World Bank, UN DESA Population Division) at www.childmortality.org.
Categories, topics:
Health
Last updated:
apr 23, 2017
Indicators value changes by year
Mean:
70.846
Minimum:
46.0
jan 1, 2016
Maximum:
93.0
jan 1, 1997
At the date of observation
Value
Absolute change
Change from previous value
jan 1, 1991
81.0
+81.0
0.0%
jan 1, 1992
81.0
0.0
0.0%
jan 1, 1993
84.0
+3.0
3.7%
jan 1, 1994
88.0
+4.0
4.76%
jan 1, 1995
90.0
+2.0
2.27%
jan 1, 1996
92.0
+2.0
2.22%
jan 1, 1997
93.0
+1.0
1.09%
jan 1, 1998
93.0
0.0
0.0%
jan 1, 1999
91.0
-2.0
-2.15%
jan 1, 2000
88.0
-3.0
-3.3%
jan 1, 2001
84.0
-4.0
-4.55%
jan 1, 2002
80.0
-4.0
-4.76%
jan 1, 2003
76.0
-4.0
-5.0%
jan 1, 2004
71.0
-5.0
-6.58%
jan 1, 2005
67.0
-4.0
-5.63%
jan 1, 2006
63.0
-4.0
-5.97%
jan 1, 2007
60.0
-3.0
-4.76%
jan 1, 2008
58.0
-2.0
-3.33%
jan 1, 2009
55.0
-3.0
-5.17%
jan 1, 2010
54.0
-1.0
-1.82%
jan 1, 2011
52.0
-2.0
-3.7%
jan 1, 2012
51.0
-1.0
-1.92%
jan 1, 2013
49.0
-2.0
-3.92%
jan 1, 2014
48.0
-1.0
-2.04%
jan 1, 2015
47.0
-1.0
-2.08%
jan 1, 2016
46.0
-1.0
-2.13%
Ranking of countries by current statistics by years

Comments:

Send
PremiumAbout & FeedbackTermsPrivacy
logo
© 2022 Selected Technologies LLC – Morgan Hill, California