29
/
en
AIzaSyAYiBZKx7MnpbEhh9jyipgxe19OcubqV5w
April 1, 2024
214641
Norway
NOR
true
2
1
Number of neonatal deaths
2016,2015,2014,2013,2012,2011,2010,2009,2008,2007,2006,2005,2004,2003,2002,2001,2000,1999,1998,1997,1996,1995,1994,1993,1992,1991
Download
Global statistics library →Norway →

Number of neonatal deaths

This statistics in other country:
AfghanistanAlbaniaAlgeriaAndorraAngolaAntigua and BarbudaArgentinaArmeniaAustraliaAustriaAzerbaijanBahamas, TheBahrainBangladeshBarbadosBelarusBelgiumBelizeBeninBhutanBoliviaBosnia and HerzegovinaBotswanaBrazilBrunei DarussalamBulgariaBurkina FasoBurundiCabo VerdeCambodiaCameroonCanadaCentral African RepublicChadChileChinaColombiaComorosCongo, Dem. Rep.Congo, Rep.Costa RicaCote d'IvoireCroatiaCubaCyprusCzech RepublicDenmarkDjiboutiDominicaDominican RepublicEast Asia & Pacific (excluding high income)EcuadorEgypt, Arab Rep.El SalvadorEquatorial GuineaEritreaEstoniaEthiopiaEurope & Central Asia (excluding high income)FijiFinlandFranceGabonGambia, TheGeorgiaGermanyGhanaGreeceGrenadaGuatemalaGuineaGuinea-BissauGuyanaHaitiHigh incomeHondurasHungaryIcelandIndiaIndonesiaIran, Islamic Rep.IraqIrelandIsraelItalyJamaicaJapanJordanKazakhstanKenyaKiribatiKorea, Dem. People’s Rep.Korea, Rep.KuwaitKyrgyz RepublicLao PDRLatin America & Caribbean (excluding high income)LatviaLebanonLesothoLiberiaLibyaLithuaniaLow & middle incomeLow incomeLower middle incomeLuxembourgMacedonia, FYRMadagascarMalawiMalaysiaMaldivesMaliMaltaMarshall IslandsMauritaniaMauritiusMexicoMicronesia, Fed. Sts.Middle East & North Africa (excluding high income)Middle incomeMoldovaMonacoMongoliaMontenegroMoroccoMozambiqueMyanmarNamibiaNauruNepalNetherlandsNew ZealandNicaraguaNigerNigeriaNorwayOmanPakistanPalauPanamaPapua New GuineaParaguayPeruPhilippinesPolandPortugalQatarRomaniaRussian FederationRwandaSamoaSan MarinoSao Tome and PrincipeSaudi ArabiaSenegalSerbiaSeychellesSierra LeoneSingaporeSlovak RepublicSloveniaSolomon IslandsSomaliaSouth AfricaSouth AsiaSouth SudanSpainSri LankaSt. Kitts and NevisSt. LuciaSt. Vincent and the GrenadinesSub-Saharan Africa (excluding high income)SudanSurinameSwazilandSwedenSwitzerlandSyrian Arab RepublicTajikistanTanzaniaThailandTimor-LesteTogoTongaTrinidad and TobagoTunisiaTurkeyTurkmenistanTuvaluUgandaUkraineUnited Arab EmiratesUnited KingdomUnited StatesUpper middle incomeUruguayUzbekistanVanuatuVenezuela, RBVietnamWest Bank and GazaWorldYemen, Rep.ZambiaZimbabwe
Timeline:
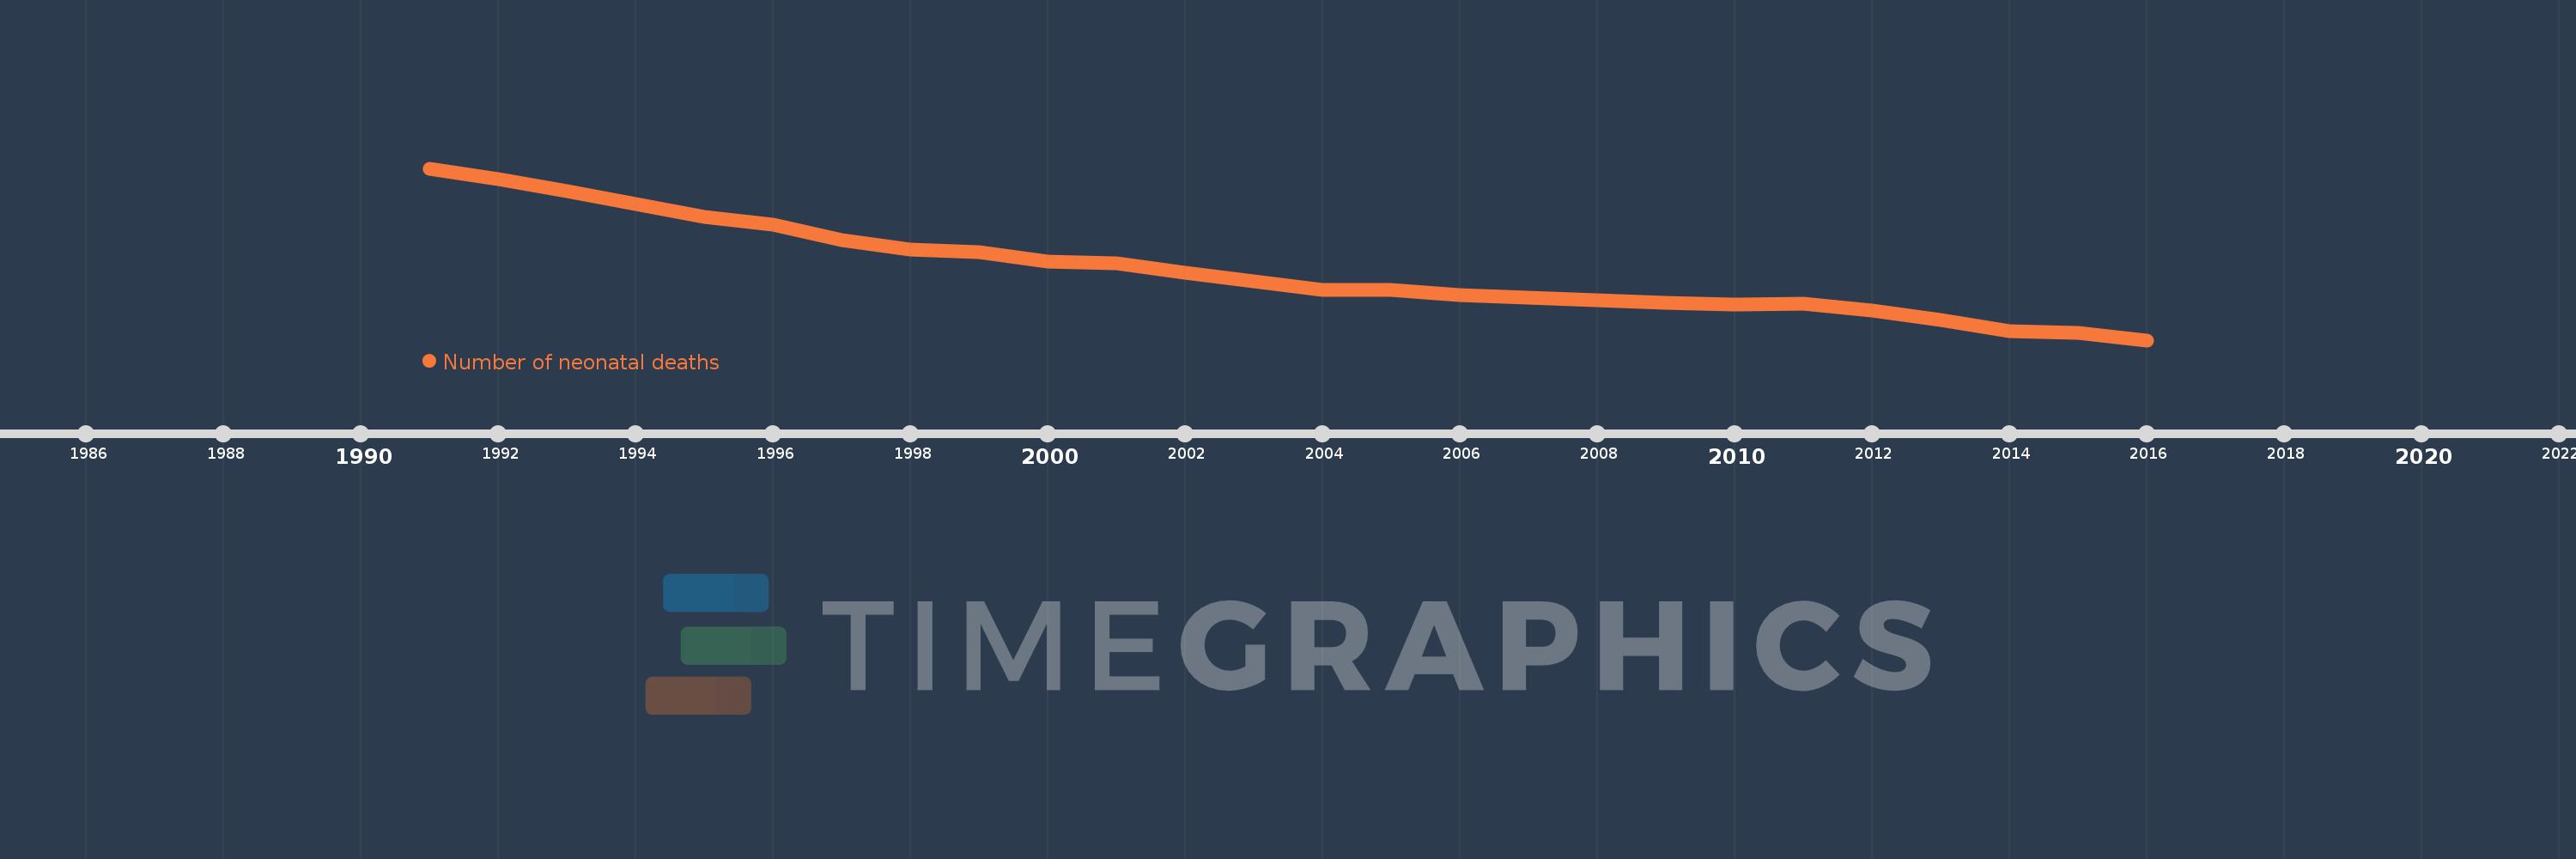
This timeline shows a graph from 1991 to 2016 of Norway. No data until 1990. Number of actual observations by date: 26.
Source name:
World Development Indicators
Source organization:
Estimates developed by the UN Inter-agency Group for Child Mortality Estimation (UNICEF, WHO, World Bank, UN DESA Population Division) at www.childmortality.org.
Categories, topics:
Health
Last updated:
apr 23, 2017
Indicators value changes by year
Mean:
150.538
Minimum:
91.0
jan 1, 2016
Maximum:
237.0
jan 1, 1991
At the date of observation
Value
Absolute change
Change from previous value
jan 1, 1991
237.0
+237.0
0.0%
jan 1, 1992
228.0
-9.0
-3.8%
jan 1, 1993
218.0
-10.0
-4.39%
jan 1, 1994
207.0
-11.0
-5.05%
jan 1, 1995
196.0
-11.0
-5.31%
jan 1, 1996
189.0
-7.0
-3.57%
jan 1, 1997
176.0
-13.0
-6.88%
jan 1, 1998
168.0
-8.0
-4.55%
jan 1, 1999
166.0
-2.0
-1.19%
jan 1, 2000
158.0
-8.0
-4.82%
jan 1, 2001
156.0
-2.0
-1.27%
jan 1, 2002
148.0
-8.0
-5.13%
jan 1, 2003
141.0
-7.0
-4.73%
jan 1, 2004
134.0
-7.0
-4.96%
jan 1, 2005
134.0
0.0
0.0%
jan 1, 2006
129.0
-5.0
-3.73%
jan 1, 2007
127.0
-2.0
-1.55%
jan 1, 2008
125.0
-2.0
-1.57%
jan 1, 2009
123.0
-2.0
-1.6%
jan 1, 2010
121.0
-2.0
-1.63%
jan 1, 2011
122.0
+1.0
0.83%
jan 1, 2012
116.0
-6.0
-4.92%
jan 1, 2013
108.0
-8.0
-6.9%
jan 1, 2014
99.0
-9.0
-8.33%
jan 1, 2015
97.0
-2.0
-2.02%
jan 1, 2016
91.0
-6.0
-6.19%
Ranking of countries by current statistics by years

Comments:

Send
PremiumAbout & FeedbackTermsPrivacy
logo
© 2022 Selected Technologies LLC – Morgan Hill, California