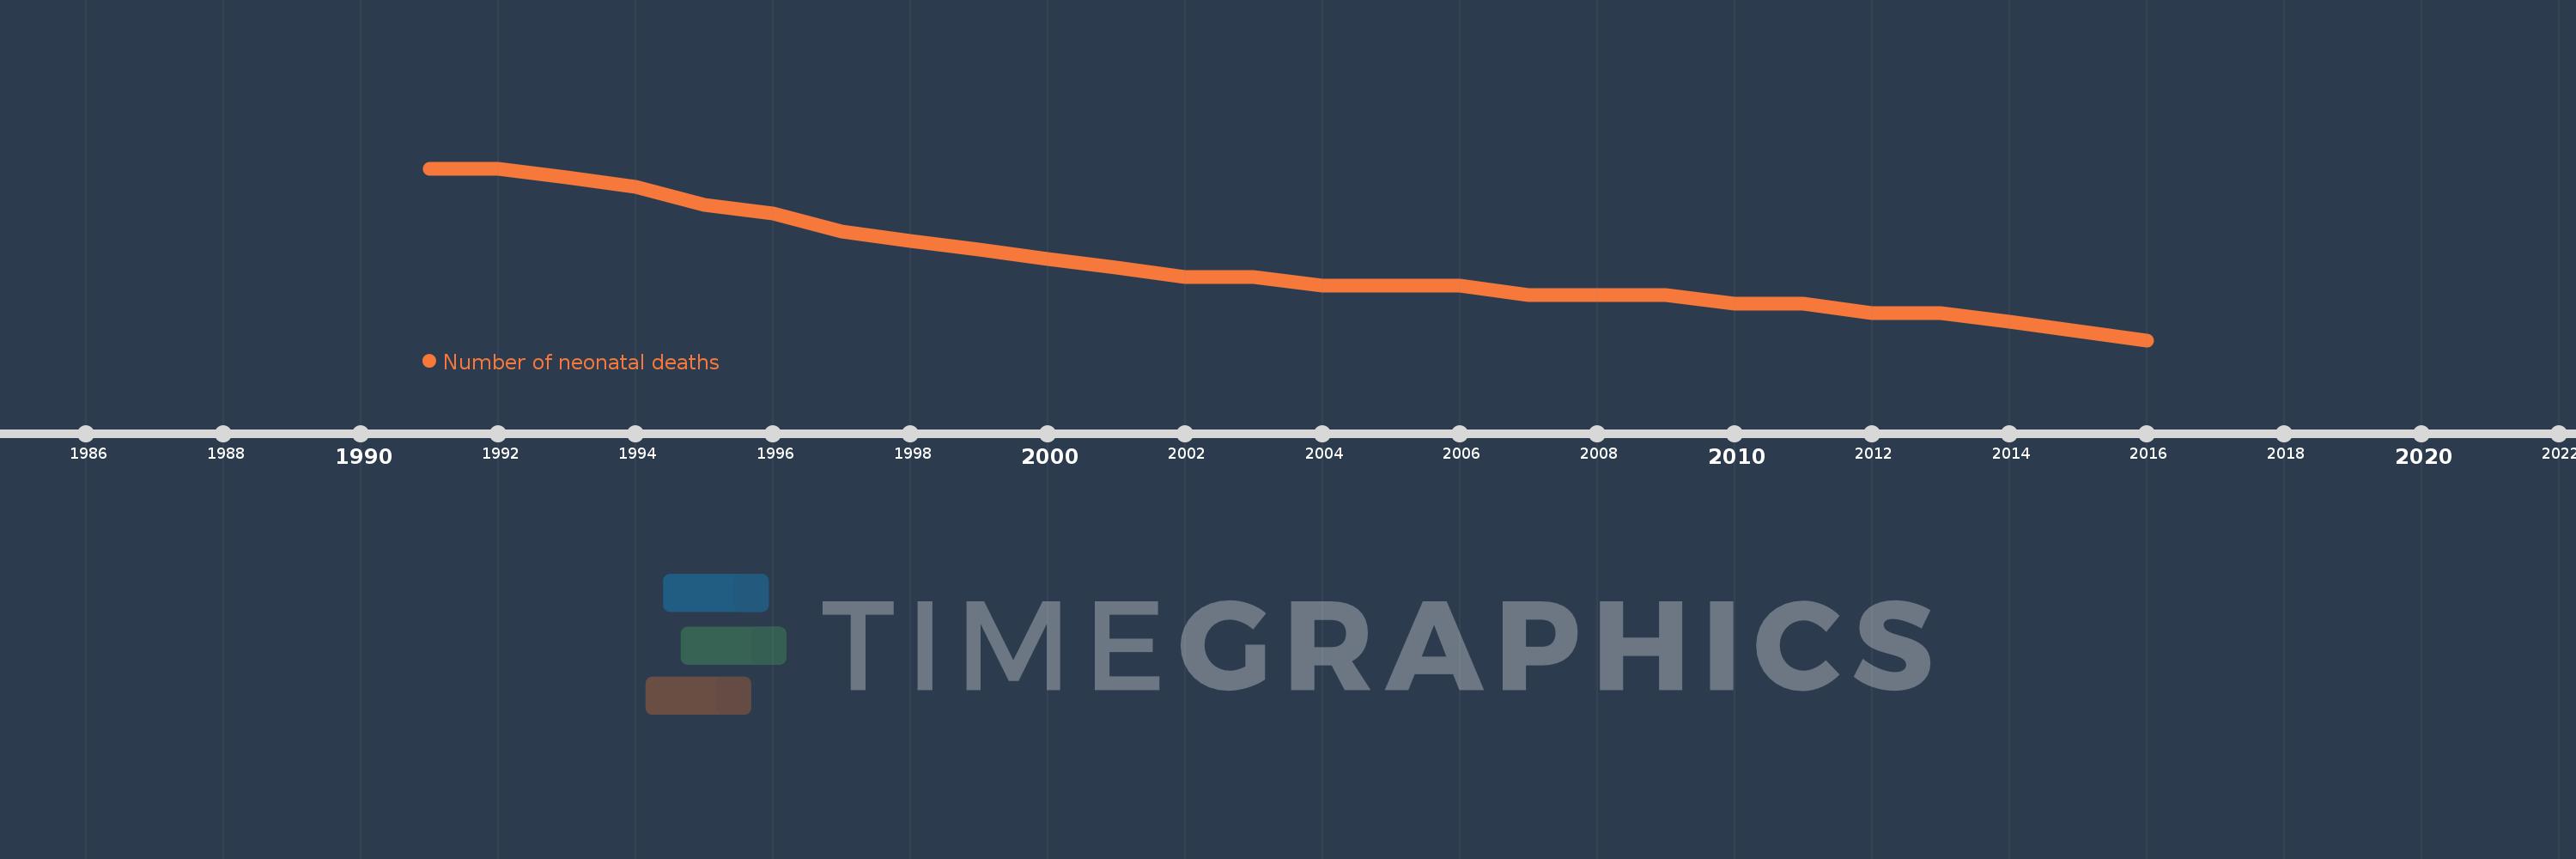
This timeline shows a graph from 1991 to 2016 of St. Lucia. No data until 1990. Number of actual observations by date: 26.
Source name:
World Development Indicators
Source organization:
Estimates developed by the UN Inter-agency Group for Child Mortality Estimation (UNICEF, WHO, World Bank, UN DESA Population Division) at www.childmortality.org.
Categories, topics:
Health
Last updated:
apr 23, 2017
Indicators value changes by year
Meaning:
34.308
Minimum:
26.0
jan 1, 2016
Maximum:
45.0
jan 1, 1991
At the date of observation
Value
Absolute change
Change from the previous value
jan 1, 1991
45.0
+45.0
0.0%
jan 1, 1992
45.0
0.0
0.0%
jan 1, 1993
44.0
-1.0
-2.22%
jan 1, 1994
43.0
-1.0
-2.27%
jan 1, 1995
41.0
-2.0
-4.65%
jan 1, 1996
40.0
-1.0
-2.44%
jan 1, 1997
38.0
-2.0
-5.0%
jan 1, 1998
37.0
-1.0
-2.63%
jan 1, 1999
36.0
-1.0
-2.7%
jan 1, 2000
35.0
-1.0
-2.78%
jan 1, 2001
34.0
-1.0
-2.86%
jan 1, 2002
33.0
-1.0
-2.94%
jan 1, 2003
33.0
0.0
0.0%
jan 1, 2004
32.0
-1.0
-3.03%
jan 1, 2005
32.0
0.0
0.0%
jan 1, 2006
32.0
0.0
0.0%
jan 1, 2007
31.0
-1.0
-3.13%
jan 1, 2008
31.0
0.0
0.0%
jan 1, 2009
31.0
0.0
0.0%
jan 1, 2010
30.0
-1.0
-3.23%
jan 1, 2011
30.0
0.0
0.0%
jan 1, 2012
29.0
-1.0
-3.33%
jan 1, 2013
29.0
0.0
0.0%
jan 1, 2014
28.0
-1.0
-3.45%
jan 1, 2015
27.0
-1.0
-3.57%
jan 1, 2016
26.0
-1.0
-3.7%
Ranking of countries by current statistics by years