29
/
en
AIzaSyAYiBZKx7MnpbEhh9jyipgxe19OcubqV5w
April 1, 2024
132389
Fiji
FJI
true
2
1
Number of neonatal deaths
2016,2015,2014,2013,2012,2011,2010,2009,2008,2007,2006,2005,2004,2003,2002,2001,2000,1999,1998,1997,1996,1995,1994,1993,1992,1991
Download
Global statistics library →Fiji →

Number of neonatal deaths

This statistics in other country:
AfghanistanAlbaniaAlgeriaAndorraAngolaAntigua and BarbudaArgentinaArmeniaAustraliaAustriaAzerbaijanBahamas, TheBahrainBangladeshBarbadosBelarusBelgiumBelizeBeninBhutanBoliviaBosnia and HerzegovinaBotswanaBrazilBrunei DarussalamBulgariaBurkina FasoBurundiCabo VerdeCambodiaCameroonCanadaCentral African RepublicChadChileChinaColombiaComorosCongo, Dem. Rep.Congo, Rep.Costa RicaCote d'IvoireCroatiaCubaCyprusCzech RepublicDenmarkDjiboutiDominicaDominican RepublicEast Asia & Pacific (excluding high income)EcuadorEgypt, Arab Rep.El SalvadorEquatorial GuineaEritreaEstoniaEthiopiaEurope & Central Asia (excluding high income)FijiFinlandFranceGabonGambia, TheGeorgiaGermanyGhanaGreeceGrenadaGuatemalaGuineaGuinea-BissauGuyanaHaitiHigh incomeHondurasHungaryIcelandIndiaIndonesiaIran, Islamic Rep.IraqIrelandIsraelItalyJamaicaJapanJordanKazakhstanKenyaKiribatiKorea, Dem. People’s Rep.Korea, Rep.KuwaitKyrgyz RepublicLao PDRLatin America & Caribbean (excluding high income)LatviaLebanonLesothoLiberiaLibyaLithuaniaLow & middle incomeLow incomeLower middle incomeLuxembourgMacedonia, FYRMadagascarMalawiMalaysiaMaldivesMaliMaltaMarshall IslandsMauritaniaMauritiusMexicoMicronesia, Fed. Sts.Middle East & North Africa (excluding high income)Middle incomeMoldovaMonacoMongoliaMontenegroMoroccoMozambiqueMyanmarNamibiaNauruNepalNetherlandsNew ZealandNicaraguaNigerNigeriaNorwayOmanPakistanPalauPanamaPapua New GuineaParaguayPeruPhilippinesPolandPortugalQatarRomaniaRussian FederationRwandaSamoaSan MarinoSao Tome and PrincipeSaudi ArabiaSenegalSerbiaSeychellesSierra LeoneSingaporeSlovak RepublicSloveniaSolomon IslandsSomaliaSouth AfricaSouth AsiaSouth SudanSpainSri LankaSt. Kitts and NevisSt. LuciaSt. Vincent and the GrenadinesSub-Saharan Africa (excluding high income)SudanSurinameSwazilandSwedenSwitzerlandSyrian Arab RepublicTajikistanTanzaniaThailandTimor-LesteTogoTongaTrinidad and TobagoTunisiaTurkeyTurkmenistanTuvaluUgandaUkraineUnited Arab EmiratesUnited KingdomUnited StatesUpper middle incomeUruguayUzbekistanVanuatuVenezuela, RBVietnamWest Bank and GazaWorldYemen, Rep.ZambiaZimbabwe
Timeline:
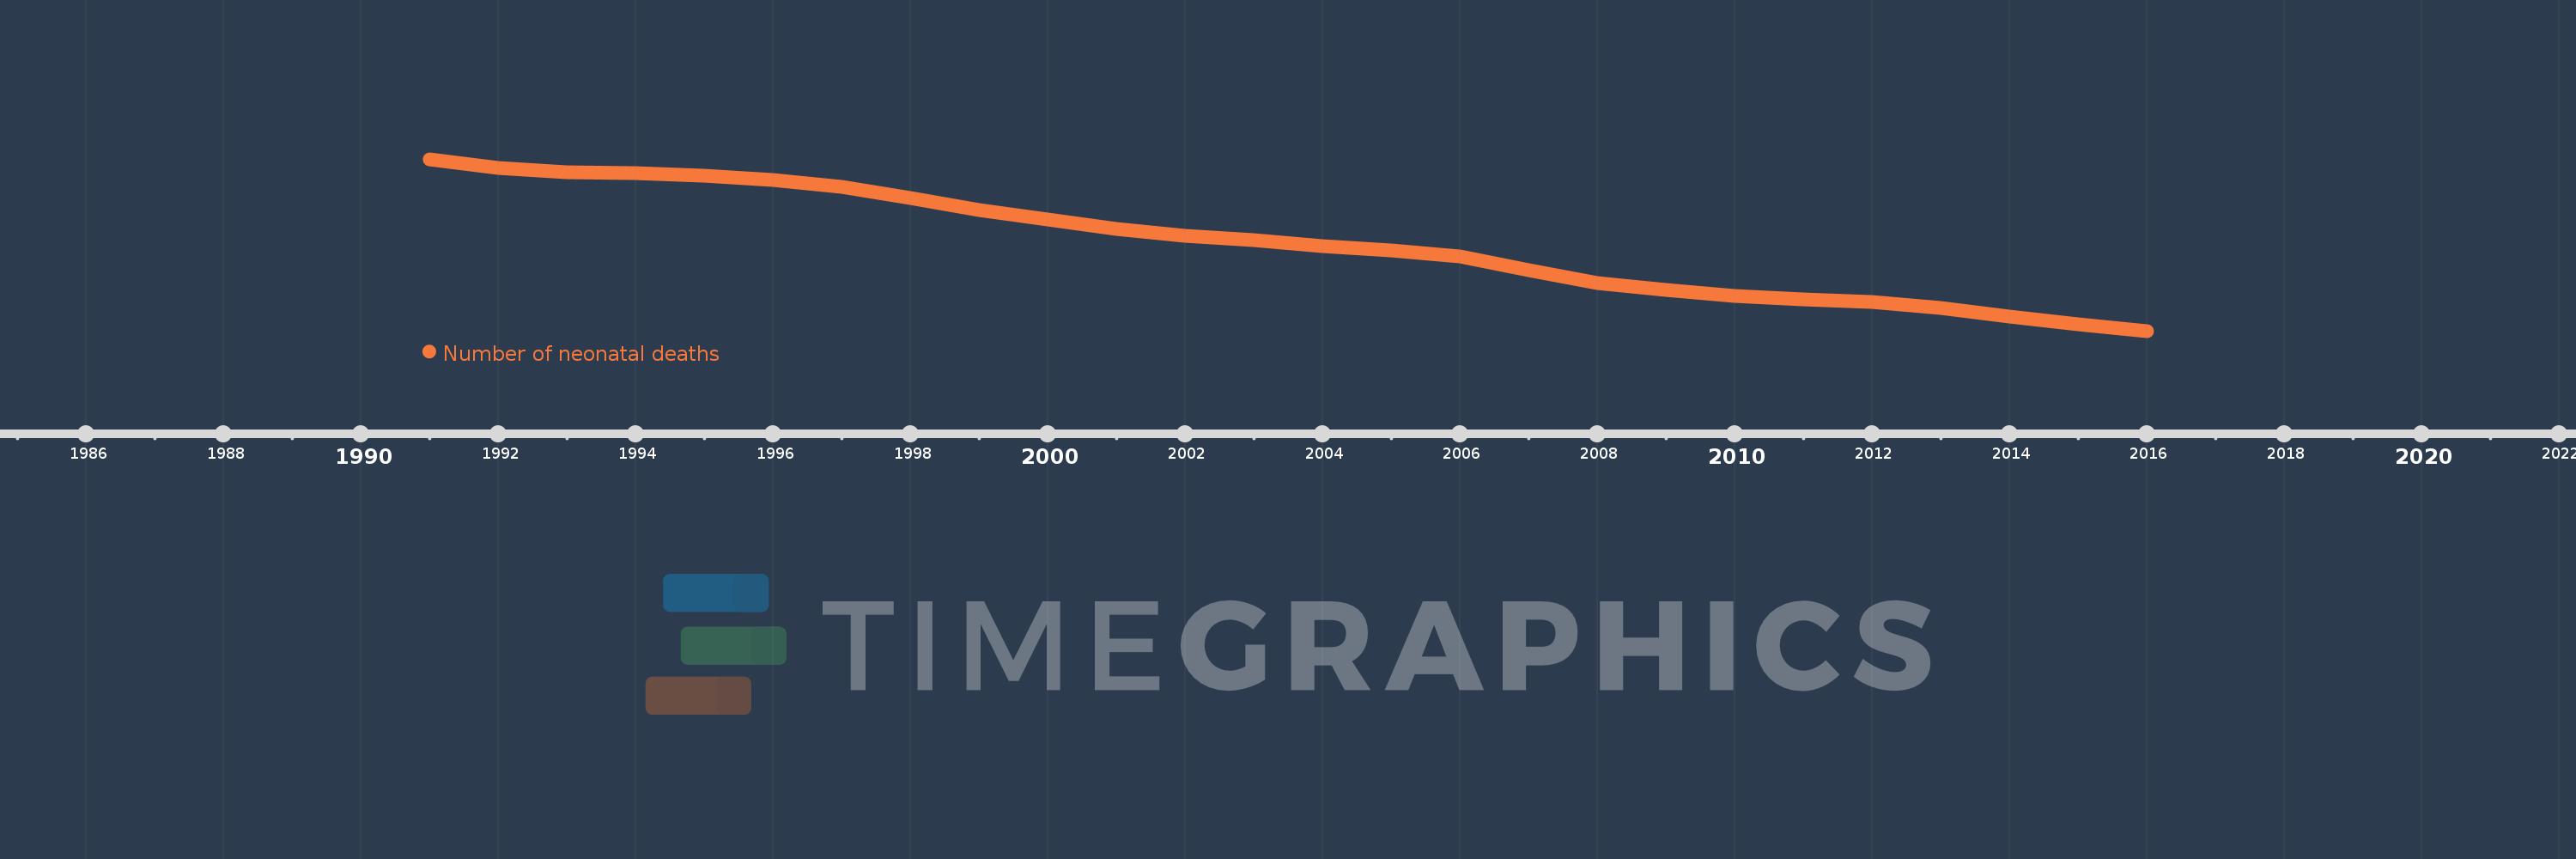
This timeline shows a graph from 1991 to 2016 of Fiji. No data until 1990. Number of actual observations by date: 26.
Source name:
World Development Indicators
Source organization:
Estimates developed by the UN Inter-agency Group for Child Mortality Estimation (UNICEF, WHO, World Bank, UN DESA Population Division) at www.childmortality.org.
Categories, topics:
Health
Last updated:
apr 23, 2017
Indicators value changes by year
Mean:
256.038
Minimum:
164.0
jan 1, 2016
Maximum:
344.0
jan 1, 1991
At the date of observation
Value
Absolute change
Change from previous value
jan 1, 1991
344.0
+344.0
0.0%
jan 1, 1992
335.0
-9.0
-2.62%
jan 1, 1993
330.0
-5.0
-1.49%
jan 1, 1994
329.0
-1.0
-0.3%
jan 1, 1995
327.0
-2.0
-0.61%
jan 1, 1996
322.0
-5.0
-1.53%
jan 1, 1997
315.0
-7.0
-2.17%
jan 1, 1998
303.0
-12.0
-3.81%
jan 1, 1999
291.0
-12.0
-3.96%
jan 1, 2000
281.0
-10.0
-3.44%
jan 1, 2001
271.0
-10.0
-3.56%
jan 1, 2002
264.0
-7.0
-2.58%
jan 1, 2003
259.0
-5.0
-1.89%
jan 1, 2004
253.0
-6.0
-2.32%
jan 1, 2005
248.0
-5.0
-1.98%
jan 1, 2006
242.0
-6.0
-2.42%
jan 1, 2007
228.0
-14.0
-5.79%
jan 1, 2008
214.0
-14.0
-6.14%
jan 1, 2009
207.0
-7.0
-3.27%
jan 1, 2010
201.0
-6.0
-2.9%
jan 1, 2011
197.0
-4.0
-1.99%
jan 1, 2012
194.0
-3.0
-1.52%
jan 1, 2013
188.0
-6.0
-3.09%
jan 1, 2014
179.0
-9.0
-4.79%
jan 1, 2015
171.0
-8.0
-4.47%
jan 1, 2016
164.0
-7.0
-4.09%
Ranking of countries by current statistics by years

Comments:

Send
PremiumAbout & FeedbackTermsPrivacy
logo
© 2022 Selected Technologies LLC – Morgan Hill, California