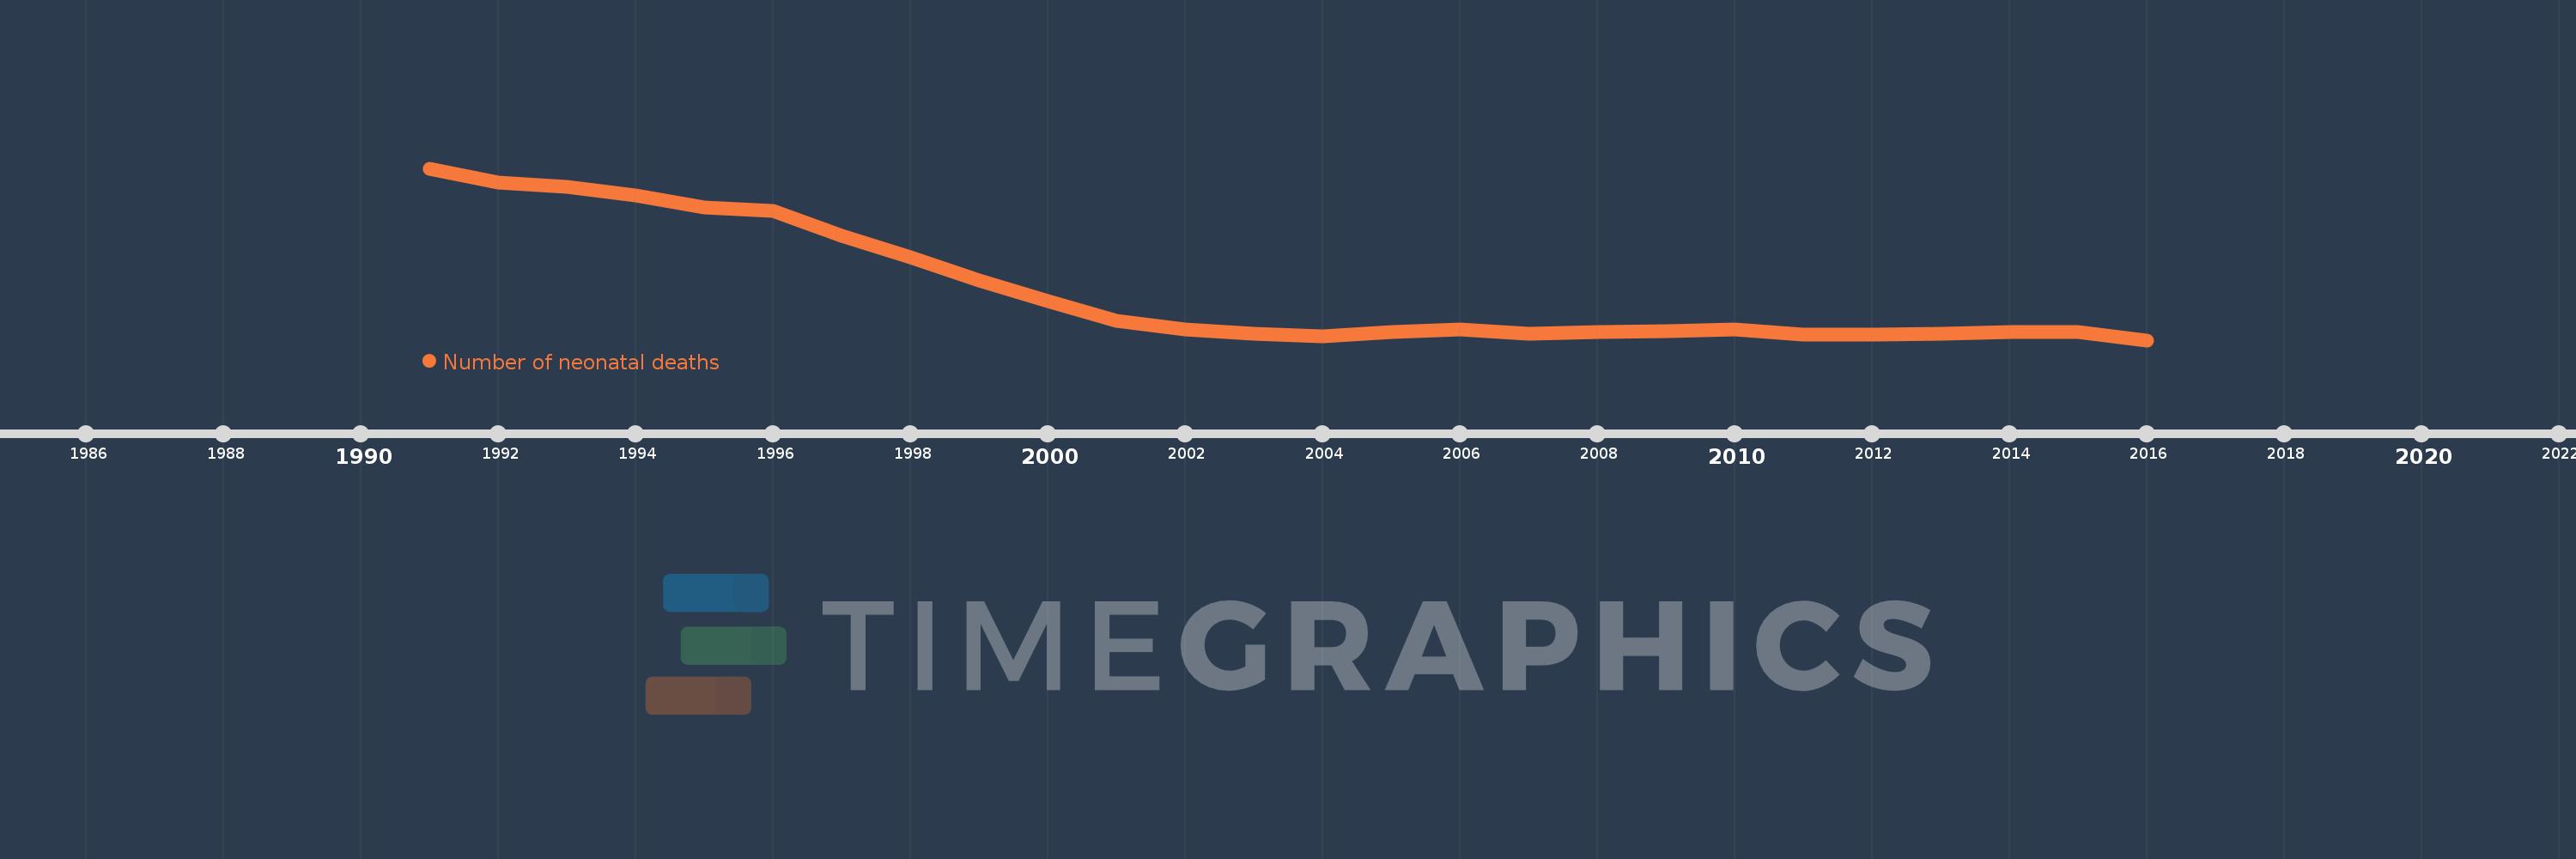
This timeline shows a graph from 1991 to 2016 of Singapore. No data until 1990. Number of actual observations by date: 26.
Source name:
World Development Indicators
Source organization:
Estimates developed by the UN Inter-agency Group for Child Mortality Estimation (UNICEF, WHO, World Bank, UN DESA Population Division) at www.childmortality.org.
Categories, topics:
Health
Last updated:
apr 23, 2017
Indicators value changes by year
Meaning:
91.692
Minimum:
53.0
jan 1, 2016
Maximum:
186.0
jan 1, 1991
At the date of observation
Value
Absolute change
Change from the previous value
jan 1, 1991
186.0
+186.0
0.0%
jan 1, 1992
175.0
-11.0
-5.91%
jan 1, 1993
172.0
-3.0
-1.71%
jan 1, 1994
165.0
-7.0
-4.07%
jan 1, 1995
156.0
-9.0
-5.45%
jan 1, 1996
153.0
-3.0
-1.92%
jan 1, 1997
134.0
-19.0
-12.42%
jan 1, 1998
117.0
-17.0
-12.69%
jan 1, 1999
99.0
-18.0
-15.38%
jan 1, 2000
83.0
-16.0
-16.16%
jan 1, 2001
68.0
-15.0
-18.07%
jan 1, 2002
61.0
-7.0
-10.29%
jan 1, 2003
58.0
-3.0
-4.92%
jan 1, 2004
56.0
-2.0
-3.45%
jan 1, 2005
59.0
+3.0
5.36%
jan 1, 2006
61.0
+2.0
3.39%
jan 1, 2007
58.0
-3.0
-4.92%
jan 1, 2008
59.0
+1.0
1.72%
jan 1, 2009
60.0
+1.0
1.69%
jan 1, 2010
61.0
+1.0
1.67%
jan 1, 2011
57.0
-4.0
-6.56%
jan 1, 2012
57.0
0.0
0.0%
jan 1, 2013
58.0
+1.0
1.75%
jan 1, 2014
59.0
+1.0
1.72%
jan 1, 2015
59.0
0.0
0.0%
jan 1, 2016
53.0
-6.0
-10.17%
Ranking of countries by current statistics by years