33
/
AIzaSyAYiBZKx7MnpbEhh9jyipgxe19OcubqV5w
August 1, 2025
129717
Estonia
EST
true
2
1
Number of neonatal deaths
2016,2015,2014,2013,2012,2011,2010,2009,2008,2007,2006,2005,2004,2003,2002,2001,2000,1999,1998,1997,1996,1995,1994,1993,1992,1991
Download
Global statistics library →Estonia →

Number of neonatal deaths

This statistics in other country:

AfghanistanAlbaniaAlgeriaAndorraAngolaAntigua and BarbudaArgentinaArmeniaAustraliaAustriaAzerbaijanBahamas, TheBahrainBangladeshBarbadosBelarusBelgiumBelizeBeninBhutanBoliviaBosnia and HerzegovinaBotswanaBrazilBrunei DarussalamBulgariaBurkina FasoBurundiCabo VerdeCambodiaCameroonCanadaCentral African RepublicChadChileChinaColombiaComorosCongo, Dem. Rep.Congo, Rep.Costa RicaCote d'IvoireCroatiaCubaCyprusCzech RepublicDenmarkDjiboutiDominicaDominican RepublicEast Asia & Pacific (excluding high income)EcuadorEgypt, Arab Rep.El SalvadorEquatorial GuineaEritreaEstoniaEthiopiaEurope & Central Asia (excluding high income)FijiFinlandFranceGabonGambia, TheGeorgiaGermanyGhanaGreeceGrenadaGuatemalaGuineaGuinea-BissauGuyanaHaitiHigh incomeHondurasHungaryIcelandIndiaIndonesiaIran, Islamic Rep.IraqIrelandIsraelItalyJamaicaJapanJordanKazakhstanKenyaKiribatiKorea, Dem. People’s Rep.Korea, Rep.KuwaitKyrgyz RepublicLao PDRLatin America & Caribbean (excluding high income)LatviaLebanonLesothoLiberiaLibyaLithuaniaLow & middle incomeLow incomeLower middle incomeLuxembourgMacedonia, FYRMadagascarMalawiMalaysiaMaldivesMaliMaltaMarshall IslandsMauritaniaMauritiusMexicoMicronesia, Fed. Sts.Middle East & North Africa (excluding high income)Middle incomeMoldovaMonacoMongoliaMontenegroMoroccoMozambiqueMyanmarNamibiaNauruNepalNetherlandsNew ZealandNicaraguaNigerNigeriaNorwayOmanPakistanPalauPanamaPapua New GuineaParaguayPeruPhilippinesPolandPortugalQatarRomaniaRussian FederationRwandaSamoaSan MarinoSao Tome and PrincipeSaudi ArabiaSenegalSerbiaSeychellesSierra LeoneSingaporeSlovak RepublicSloveniaSolomon IslandsSomaliaSouth AfricaSouth AsiaSouth SudanSpainSri LankaSt. Kitts and NevisSt. LuciaSt. Vincent and the GrenadinesSub-Saharan Africa (excluding high income)SudanSurinameSwazilandSwedenSwitzerlandSyrian Arab RepublicTajikistanTanzaniaThailandTimor-LesteTogoTongaTrinidad and TobagoTunisiaTurkeyTurkmenistanTuvaluUgandaUkraineUnited Arab EmiratesUnited KingdomUnited StatesUpper middle incomeUruguayUzbekistanVanuatuVenezuela, RBVietnamWest Bank and GazaWorldYemen, Rep.ZambiaZimbabwe

Timeline:

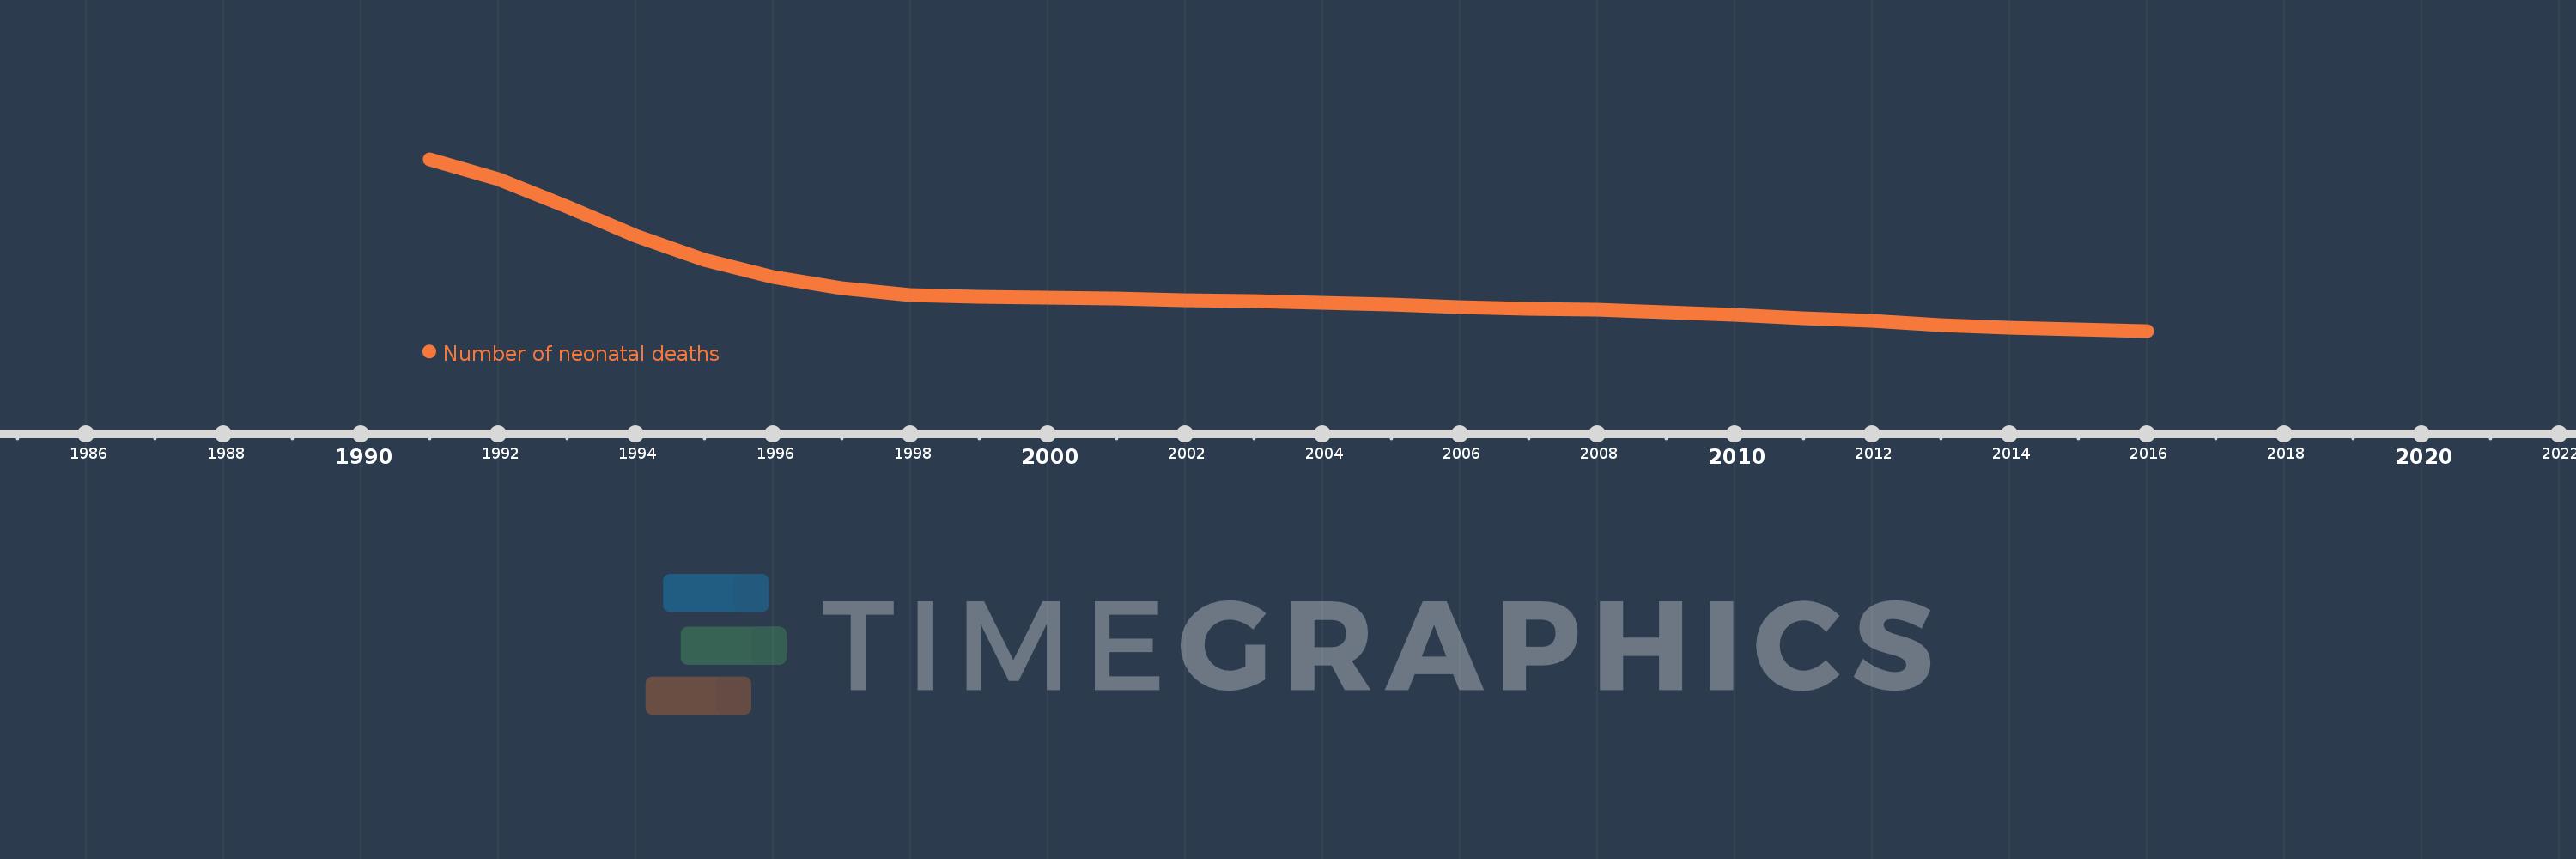
This timeline shows a graph from 1991 to 2016 of Estonia. No data until 1990. Number of actual observations by date: 26.

Source name:

World Development Indicators

Source organization:

Estimates developed by the UN Inter-agency Group for Child Mortality Estimation (UNICEF, WHO, World Bank, UN DESA Population Division) at www.childmortality.org.

Categories, topics:

Health

Last updated:

apr 23, 2017

Indicators value changes by year

Meaning:
94.846
Minimum:
18.0
jan 1, 2016
Maximum:
331.0
jan 1, 1991
At the date of observation
Value
Absolute change
Change from the previous value
jan 1, 1991
331.0
+331.0
0.0%
jan 1, 1992
294.0
-37.0
-11.18%
jan 1, 1993
244.0
-50.0
-17.01%
jan 1, 1994
192.0
-52.0
-21.31%
jan 1, 1995
148.0
-44.0
-22.92%
jan 1, 1996
116.0
-32.0
-21.62%
jan 1, 1997
95.0
-21.0
-18.1%
jan 1, 1998
84.0
-11.0
-11.58%
jan 1, 1999
80.0
-4.0
-4.76%
jan 1, 2000
78.0
-2.0
-2.5%
jan 1, 2001
77.0
-1.0
-1.28%
jan 1, 2002
74.0
-3.0
-3.9%
jan 1, 2003
73.0
-1.0
-1.35%
jan 1, 2004
69.0
-4.0
-5.48%
jan 1, 2005
66.0
-3.0
-4.35%
jan 1, 2006
62.0
-4.0
-6.06%
jan 1, 2007
59.0
-3.0
-4.84%
jan 1, 2008
56.0
-3.0
-5.08%
jan 1, 2009
52.0
-4.0
-7.14%
jan 1, 2010
47.0
-5.0
-9.62%
jan 1, 2011
41.0
-6.0
-12.77%
jan 1, 2012
36.0
-5.0
-12.2%
jan 1, 2013
29.0
-7.0
-19.44%
jan 1, 2014
24.0
-5.0
-17.24%
jan 1, 2015
21.0
-3.0
-12.5%
jan 1, 2016
18.0
-3.0
-14.29%

Ranking of countries by current statistics by years