29
/
en
AIzaSyAYiBZKx7MnpbEhh9jyipgxe19OcubqV5w
April 1, 2024
170323
Korea, Rep.
KOR
true
2
1
Number of neonatal deaths
2016,2015,2014,2013,2012,2011,2010,2009,2008,2007,2006,2005,2004,2003,2002,2001,2000,1999,1998,1997,1996,1995,1994,1993,1992,1991
Download
Global statistics library →Korea, Rep. →

Number of neonatal deaths

This statistics in other country:
AfghanistanAlbaniaAlgeriaAndorraAngolaAntigua and BarbudaArgentinaArmeniaAustraliaAustriaAzerbaijanBahamas, TheBahrainBangladeshBarbadosBelarusBelgiumBelizeBeninBhutanBoliviaBosnia and HerzegovinaBotswanaBrazilBrunei DarussalamBulgariaBurkina FasoBurundiCabo VerdeCambodiaCameroonCanadaCentral African RepublicChadChileChinaColombiaComorosCongo, Dem. Rep.Congo, Rep.Costa RicaCote d'IvoireCroatiaCubaCyprusCzech RepublicDenmarkDjiboutiDominicaDominican RepublicEast Asia & Pacific (excluding high income)EcuadorEgypt, Arab Rep.El SalvadorEquatorial GuineaEritreaEstoniaEthiopiaEurope & Central Asia (excluding high income)FijiFinlandFranceGabonGambia, TheGeorgiaGermanyGhanaGreeceGrenadaGuatemalaGuineaGuinea-BissauGuyanaHaitiHigh incomeHondurasHungaryIcelandIndiaIndonesiaIran, Islamic Rep.IraqIrelandIsraelItalyJamaicaJapanJordanKazakhstanKenyaKiribatiKorea, Dem. People’s Rep.Korea, Rep.KuwaitKyrgyz RepublicLao PDRLatin America & Caribbean (excluding high income)LatviaLebanonLesothoLiberiaLibyaLithuaniaLow & middle incomeLow incomeLower middle incomeLuxembourgMacedonia, FYRMadagascarMalawiMalaysiaMaldivesMaliMaltaMarshall IslandsMauritaniaMauritiusMexicoMicronesia, Fed. Sts.Middle East & North Africa (excluding high income)Middle incomeMoldovaMonacoMongoliaMontenegroMoroccoMozambiqueMyanmarNamibiaNauruNepalNetherlandsNew ZealandNicaraguaNigerNigeriaNorwayOmanPakistanPalauPanamaPapua New GuineaParaguayPeruPhilippinesPolandPortugalQatarRomaniaRussian FederationRwandaSamoaSan MarinoSao Tome and PrincipeSaudi ArabiaSenegalSerbiaSeychellesSierra LeoneSingaporeSlovak RepublicSloveniaSolomon IslandsSomaliaSouth AfricaSouth AsiaSouth SudanSpainSri LankaSt. Kitts and NevisSt. LuciaSt. Vincent and the GrenadinesSub-Saharan Africa (excluding high income)SudanSurinameSwazilandSwedenSwitzerlandSyrian Arab RepublicTajikistanTanzaniaThailandTimor-LesteTogoTongaTrinidad and TobagoTunisiaTurkeyTurkmenistanTuvaluUgandaUkraineUnited Arab EmiratesUnited KingdomUnited StatesUpper middle incomeUruguayUzbekistanVanuatuVenezuela, RBVietnamWest Bank and GazaWorldYemen, Rep.ZambiaZimbabwe
Timeline:
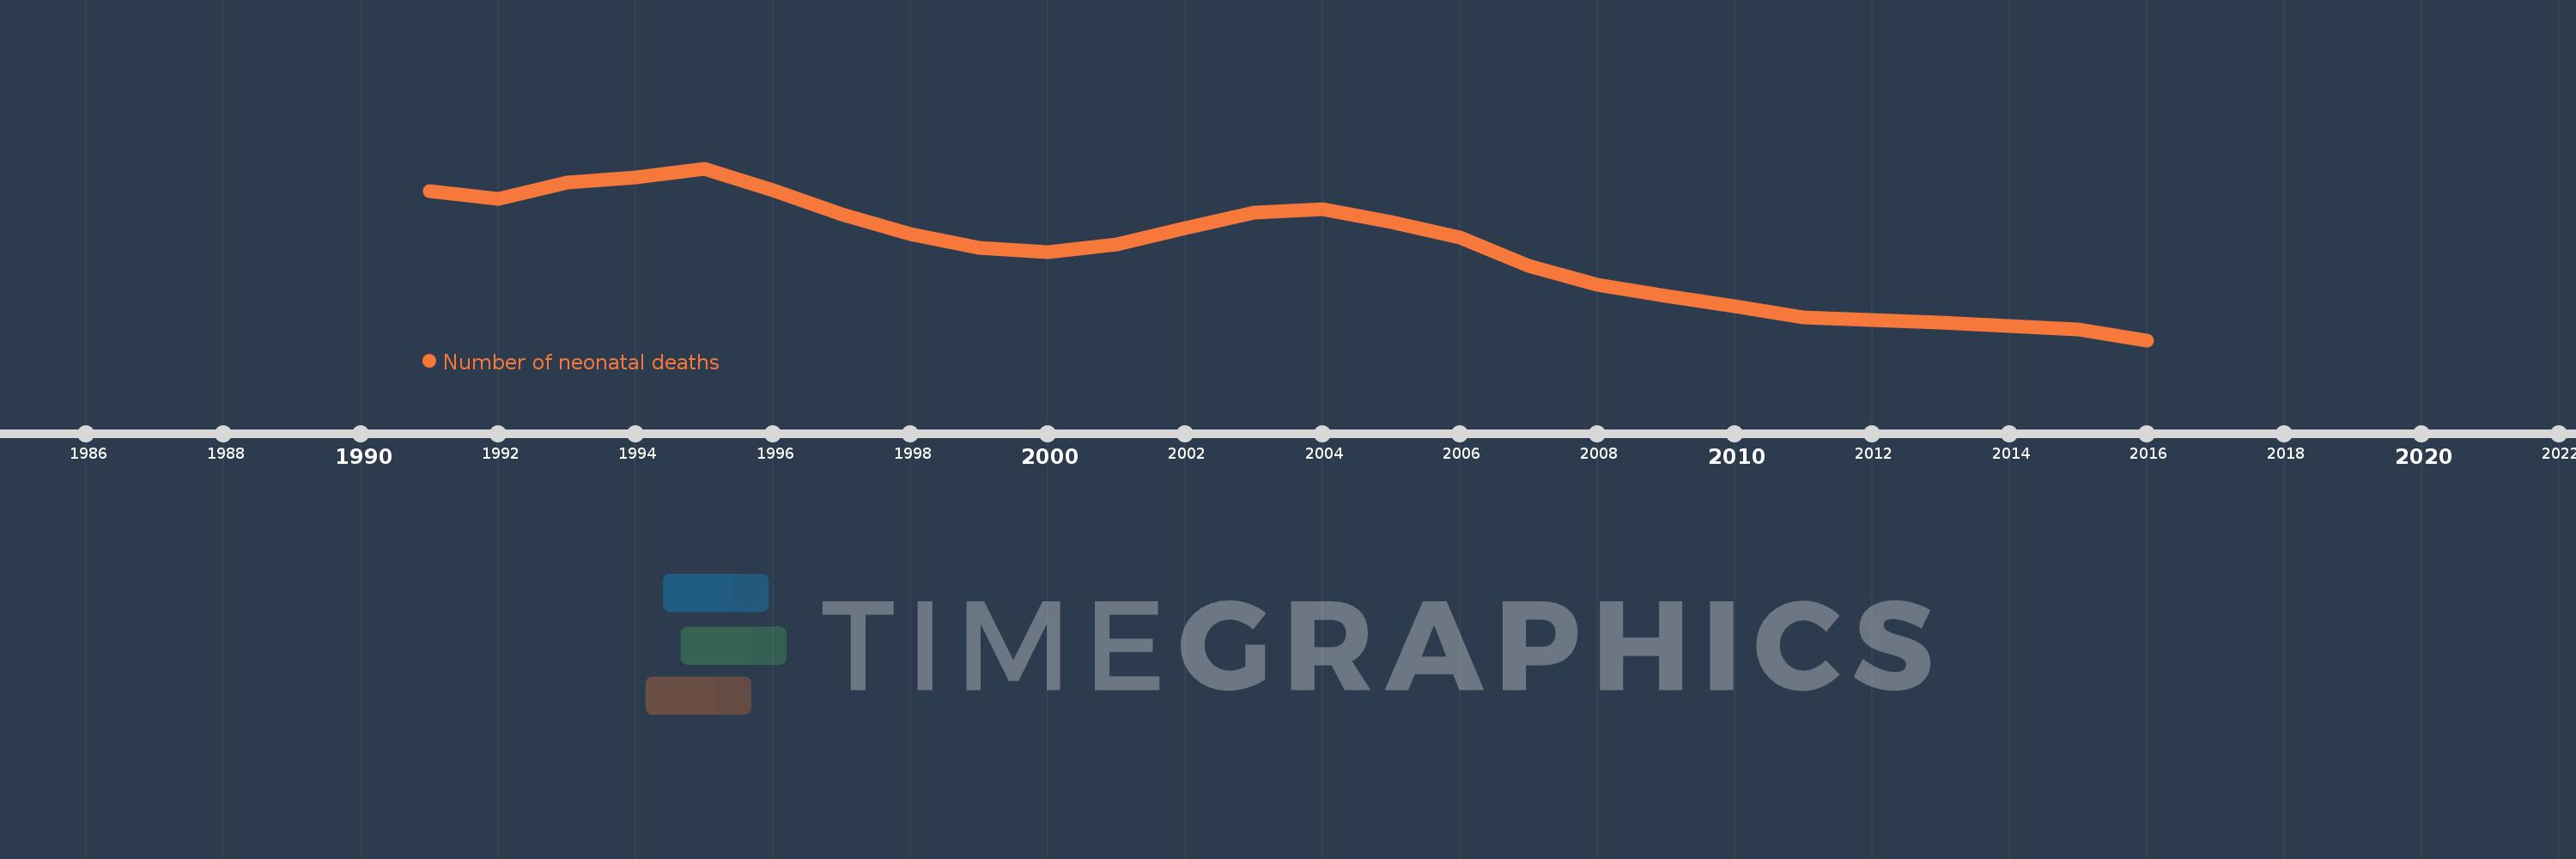
This timeline shows a graph from 1991 to 2016 of Korea, Rep.. No data until 1990. Number of actual observations by date: 26.
Source name:
World Development Indicators
Source organization:
Estimates developed by the UN Inter-agency Group for Child Mortality Estimation (UNICEF, WHO, World Bank, UN DESA Population Division) at www.childmortality.org.
Categories, topics:
Health
Last updated:
apr 23, 2017
Indicators value changes by year
Mean:
1.2K
Minimum:
733.0
jan 1, 2016
Maximum:
1.631K
jan 1, 1995
At the date of observation
Value
Absolute change
Change from previous value
jan 1, 1991
1.514K
+1.514K
0.0%
jan 1, 1992
1.47K
-44.0
-2.91%
jan 1, 1993
1.555K
+85.0
5.78%
jan 1, 1994
1.584K
+29.0
1.86%
jan 1, 1995
1.631K
+47.0
2.97%
jan 1, 1996
1.517K
-114.0
-6.99%
jan 1, 1997
1.392K
-125.0
-8.24%
jan 1, 1998
1.288K
-104.0
-7.47%
jan 1, 1999
1.215K
-73.0
-5.67%
jan 1, 2000
1.191K
-24.0
-1.98%
jan 1, 2001
1.235K
+44.0
3.69%
jan 1, 2002
1.32K
+85.0
6.88%
jan 1, 2003
1.399K
+79.0
5.98%
jan 1, 2004
1.419K
+20.0
1.43%
jan 1, 2005
1.35K
-69.0
-4.86%
jan 1, 2006
1.27K
-80.0
-5.93%
jan 1, 2007
1.122K
-148.0
-11.65%
jan 1, 2008
1.021K
-101.0
-9.0%
jan 1, 2009
966.0
-55.0
-5.39%
jan 1, 2010
910.0
-56.0
-5.8%
jan 1, 2011
851.0
-59.0
-6.48%
jan 1, 2012
839.0
-12.0
-1.41%
jan 1, 2013
824.0
-15.0
-1.79%
jan 1, 2014
806.0
-18.0
-2.18%
jan 1, 2015
791.0
-15.0
-1.86%
jan 1, 2016
733.0
-58.0
-7.33%
Ranking of countries by current statistics by years

Comments:

Send
PremiumAbout & FeedbackTermsPrivacy
logo
© 2022 Selected Technologies LLC – Morgan Hill, California