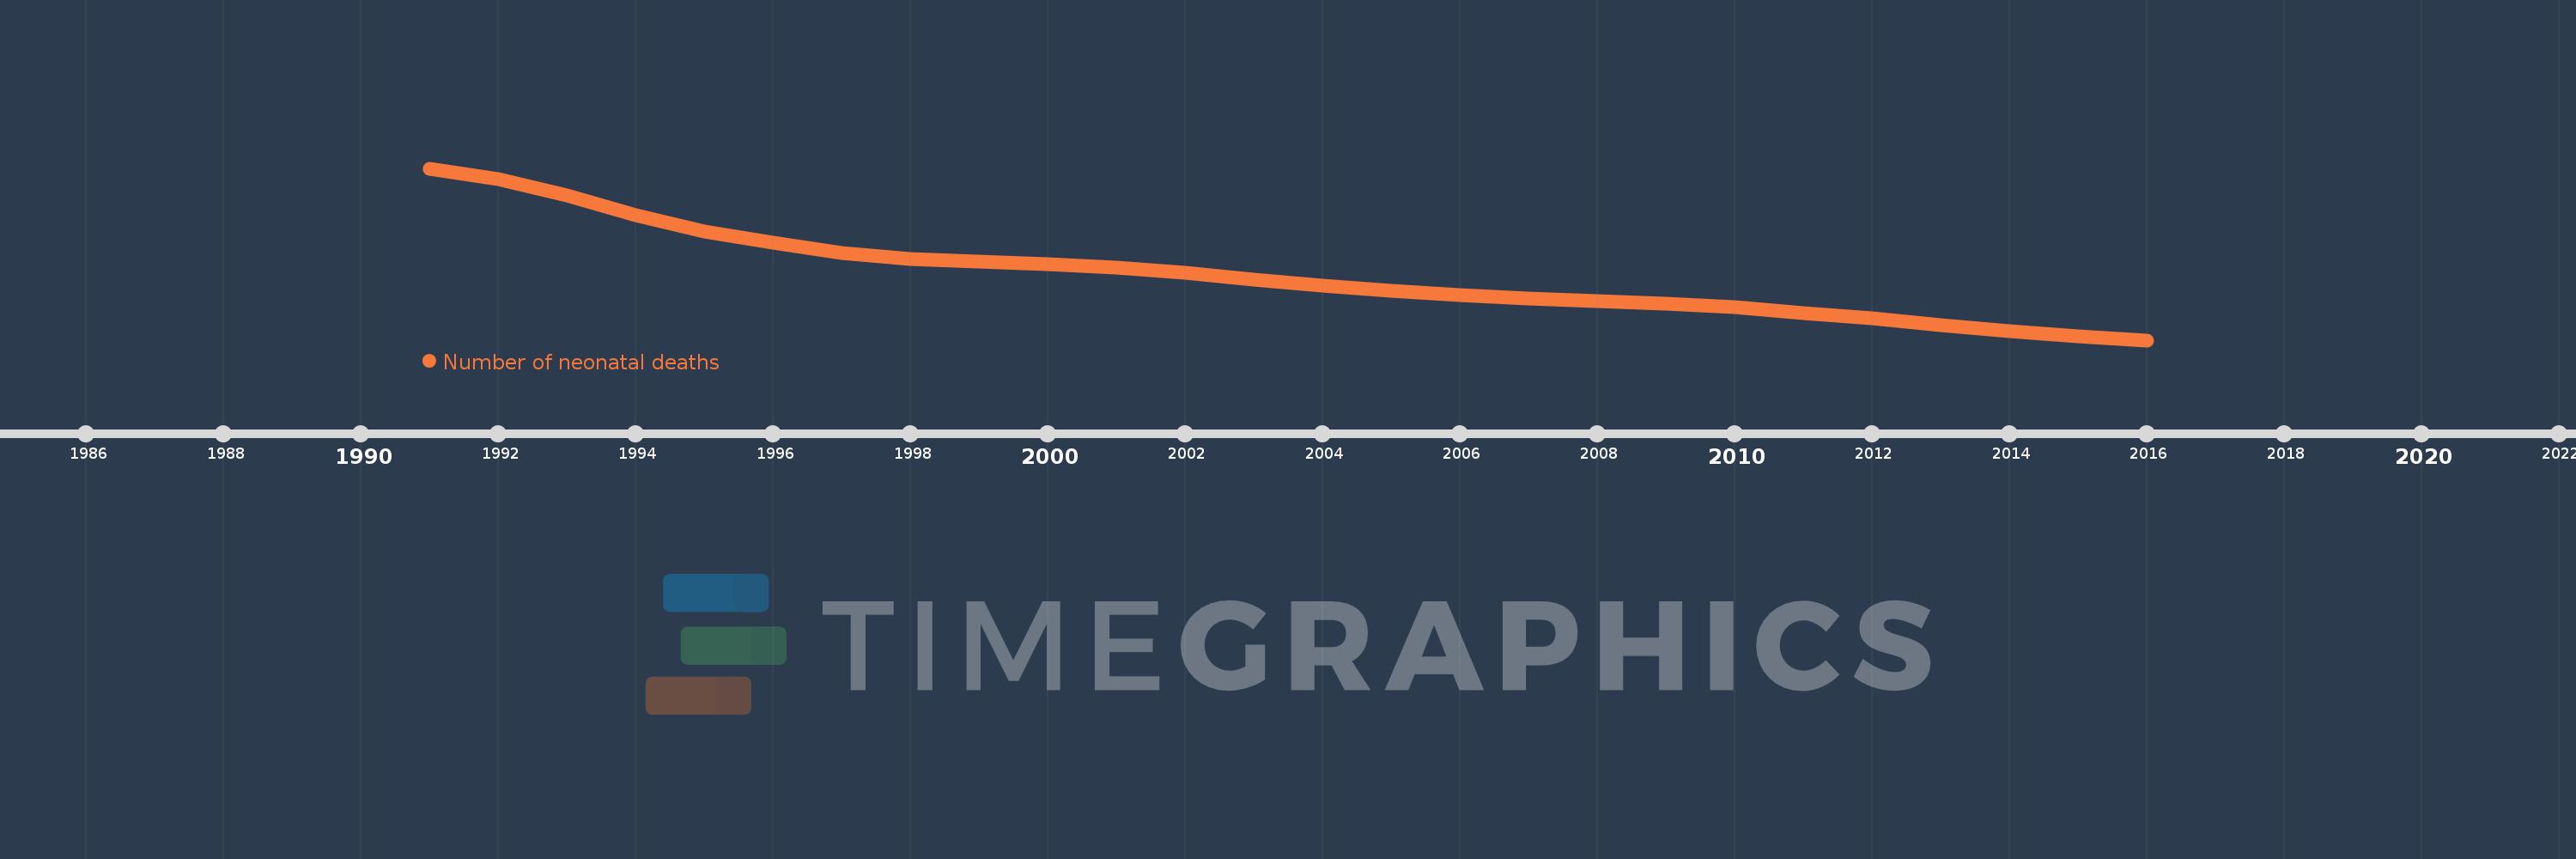
This timeline shows a graph from 1991 to 2016 of Bhutan. No data until 1990. Number of actual observations by date: 26.
Source name:
World Development Indicators
Source organization:
Estimates developed by the UN Inter-agency Group for Child Mortality Estimation (UNICEF, WHO, World Bank, UN DESA Population Division) at www.childmortality.org.
Categories, topics:
Health
Last updated:
apr 23, 2017
Indicators value changes by year
Meaning:
491.308
Minimum:
226.0
jan 1, 2016
Maximum:
920.0
jan 1, 1991
At the date of observation
Value
Absolute change
Change from the previous value
jan 1, 1991
920.0
+920.0
0.0%
jan 1, 1992
875.0
-45.0
-4.89%
jan 1, 1993
810.0
-65.0
-7.43%
jan 1, 1994
732.0
-78.0
-9.63%
jan 1, 1995
666.0
-66.0
-9.02%
jan 1, 1996
620.0
-46.0
-6.91%
jan 1, 1997
579.0
-41.0
-6.61%
jan 1, 1998
554.0
-25.0
-4.32%
jan 1, 1999
542.0
-12.0
-2.17%
jan 1, 2000
532.0
-10.0
-1.85%
jan 1, 2001
518.0
-14.0
-2.63%
jan 1, 2002
497.0
-21.0
-4.05%
jan 1, 2003
471.0
-26.0
-5.23%
jan 1, 2004
448.0
-23.0
-4.88%
jan 1, 2005
426.0
-22.0
-4.91%
jan 1, 2006
407.0
-19.0
-4.46%
jan 1, 2007
394.0
-13.0
-3.19%
jan 1, 2008
384.0
-10.0
-2.54%
jan 1, 2009
373.0
-11.0
-2.86%
jan 1, 2010
358.0
-15.0
-4.02%
jan 1, 2011
337.0
-21.0
-5.87%
jan 1, 2012
314.0
-23.0
-6.82%
jan 1, 2013
287.0
-27.0
-8.6%
jan 1, 2014
262.0
-25.0
-8.71%
jan 1, 2015
242.0
-20.0
-7.63%
jan 1, 2016
226.0
-16.0
-6.61%
Ranking of countries by current statistics by years