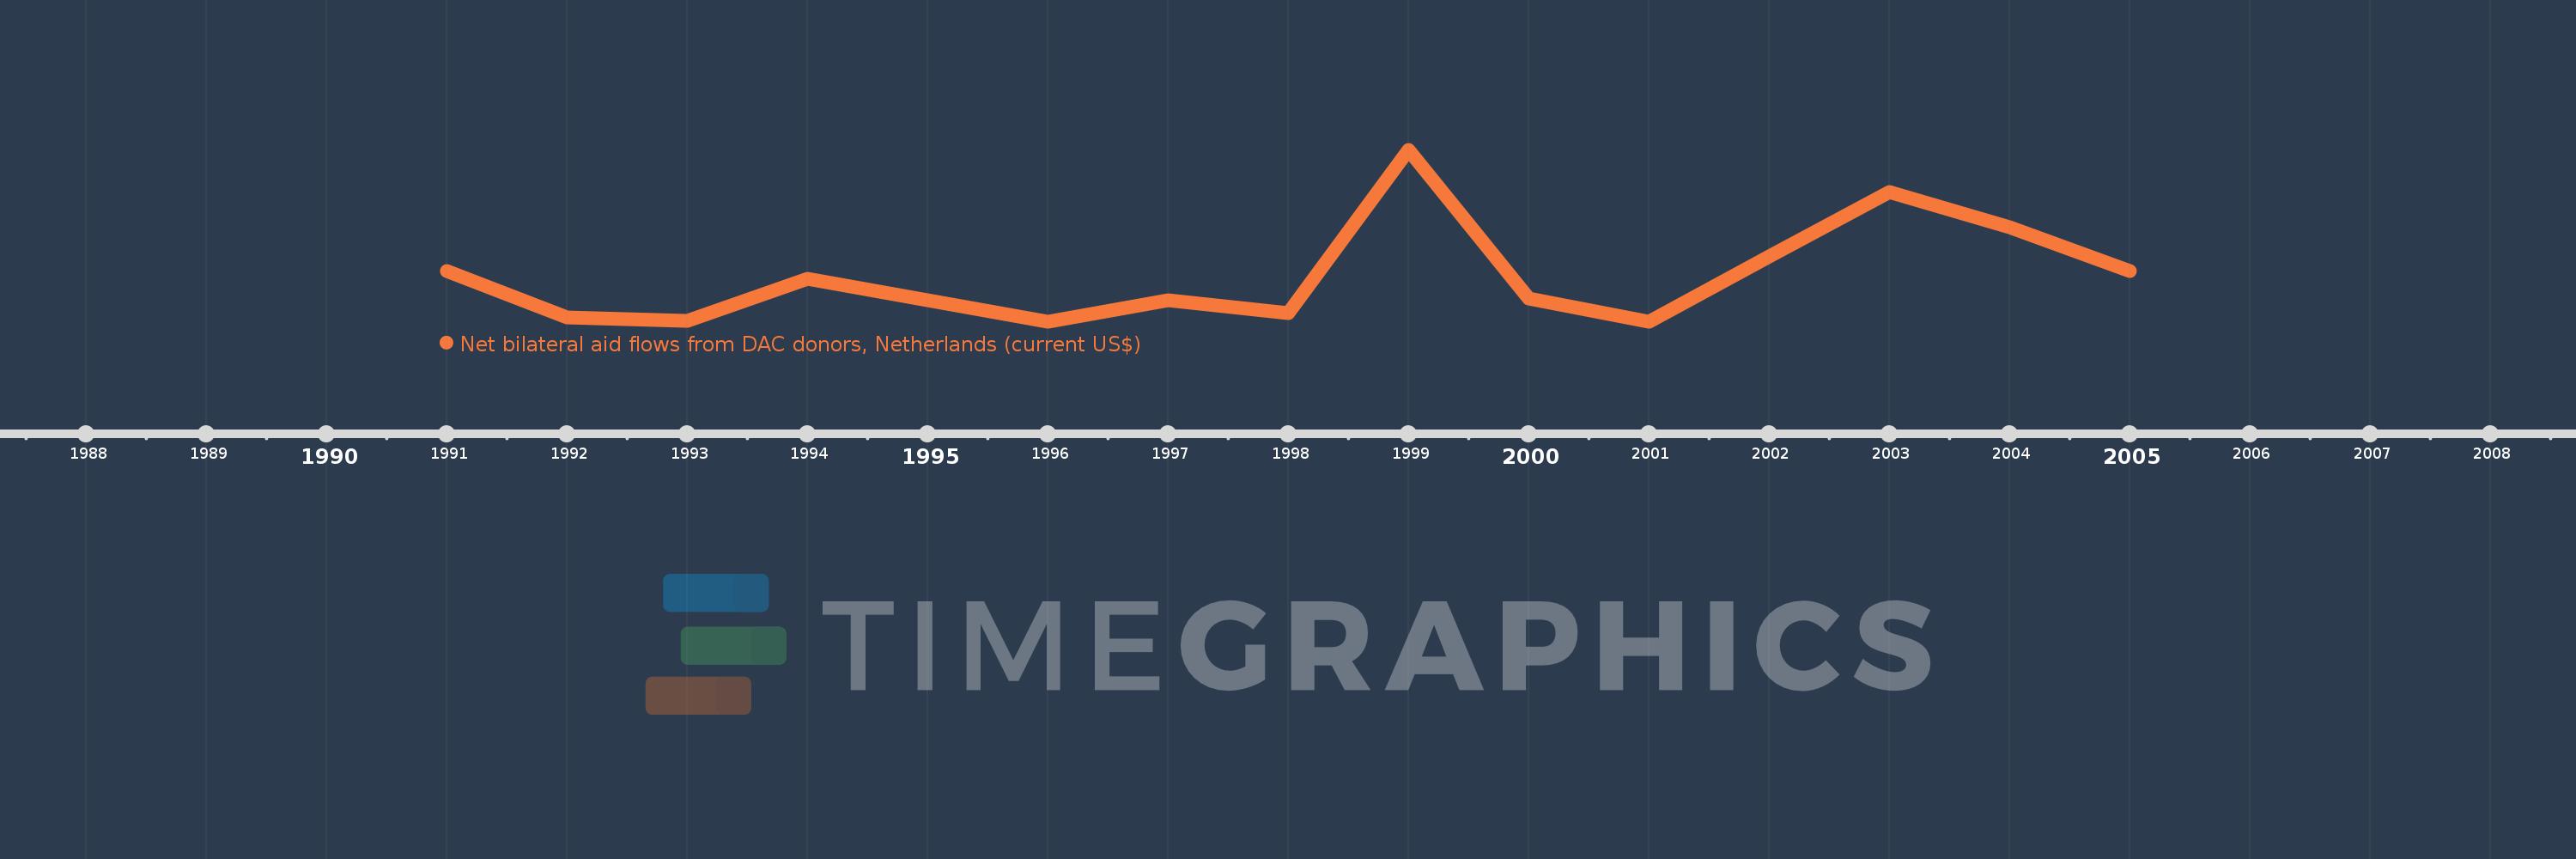
This timeline shows a graph from 1991 to 2005 of Bulgaria. No data until 1990. Number of actual observations by date: 14.
Source name:
World Development Indicators
Source organization:
Development Assistance Committee of the Organisation for Economic Co-operation and Development, Geographical Distribution of Financial Flows to Developing Countries, Development Co-operation Report, and International Development Statistics database. Data are available online at: www.oecd.org/dac/stats/idsonline.
Categories, topics:
Aid Effectiveness
Last updated:
apr 23, 2017
Indicators value changes by year
Meaning:
3.312 mln
Minimum:
650.0K
jan 1, 1996
Maximum:
10.25 mln
jan 1, 1999
At the date of observation
Value
Absolute change
Change from the previous value
jan 1, 1991
3.5 mln
+3.5 mln
0.0%
jan 1, 1992
900.0K
-2.6 mln
-74.29%
jan 1, 1993
700.0K
-200.0K
-22.22%
jan 1, 1994
3.08 mln
+2.38 mln
340.0%
jan 1, 1996
650.0K
-2.43 mln
-78.9%
jan 1, 1997
1.85 mln
+1.2 mln
184.62%
jan 1, 1998
1.14 mln
-710.0K
-38.38%
jan 1, 1999
10.25 mln
+9.11 mln
799.12%
jan 1, 2000
1.94 mln
-8.31 mln
-81.07%
jan 1, 2001
670.0K
-1.27 mln
-65.46%
jan 1, 2002
4.31 mln
+3.64 mln
543.28%
jan 1, 2003
7.92 mln
+3.61 mln
83.76%
jan 1, 2004
5.96 mln
-1.96 mln
-24.75%
jan 1, 2005
3.5 mln
-2.46 mln
-41.28%
Ranking of countries by current statistics by years