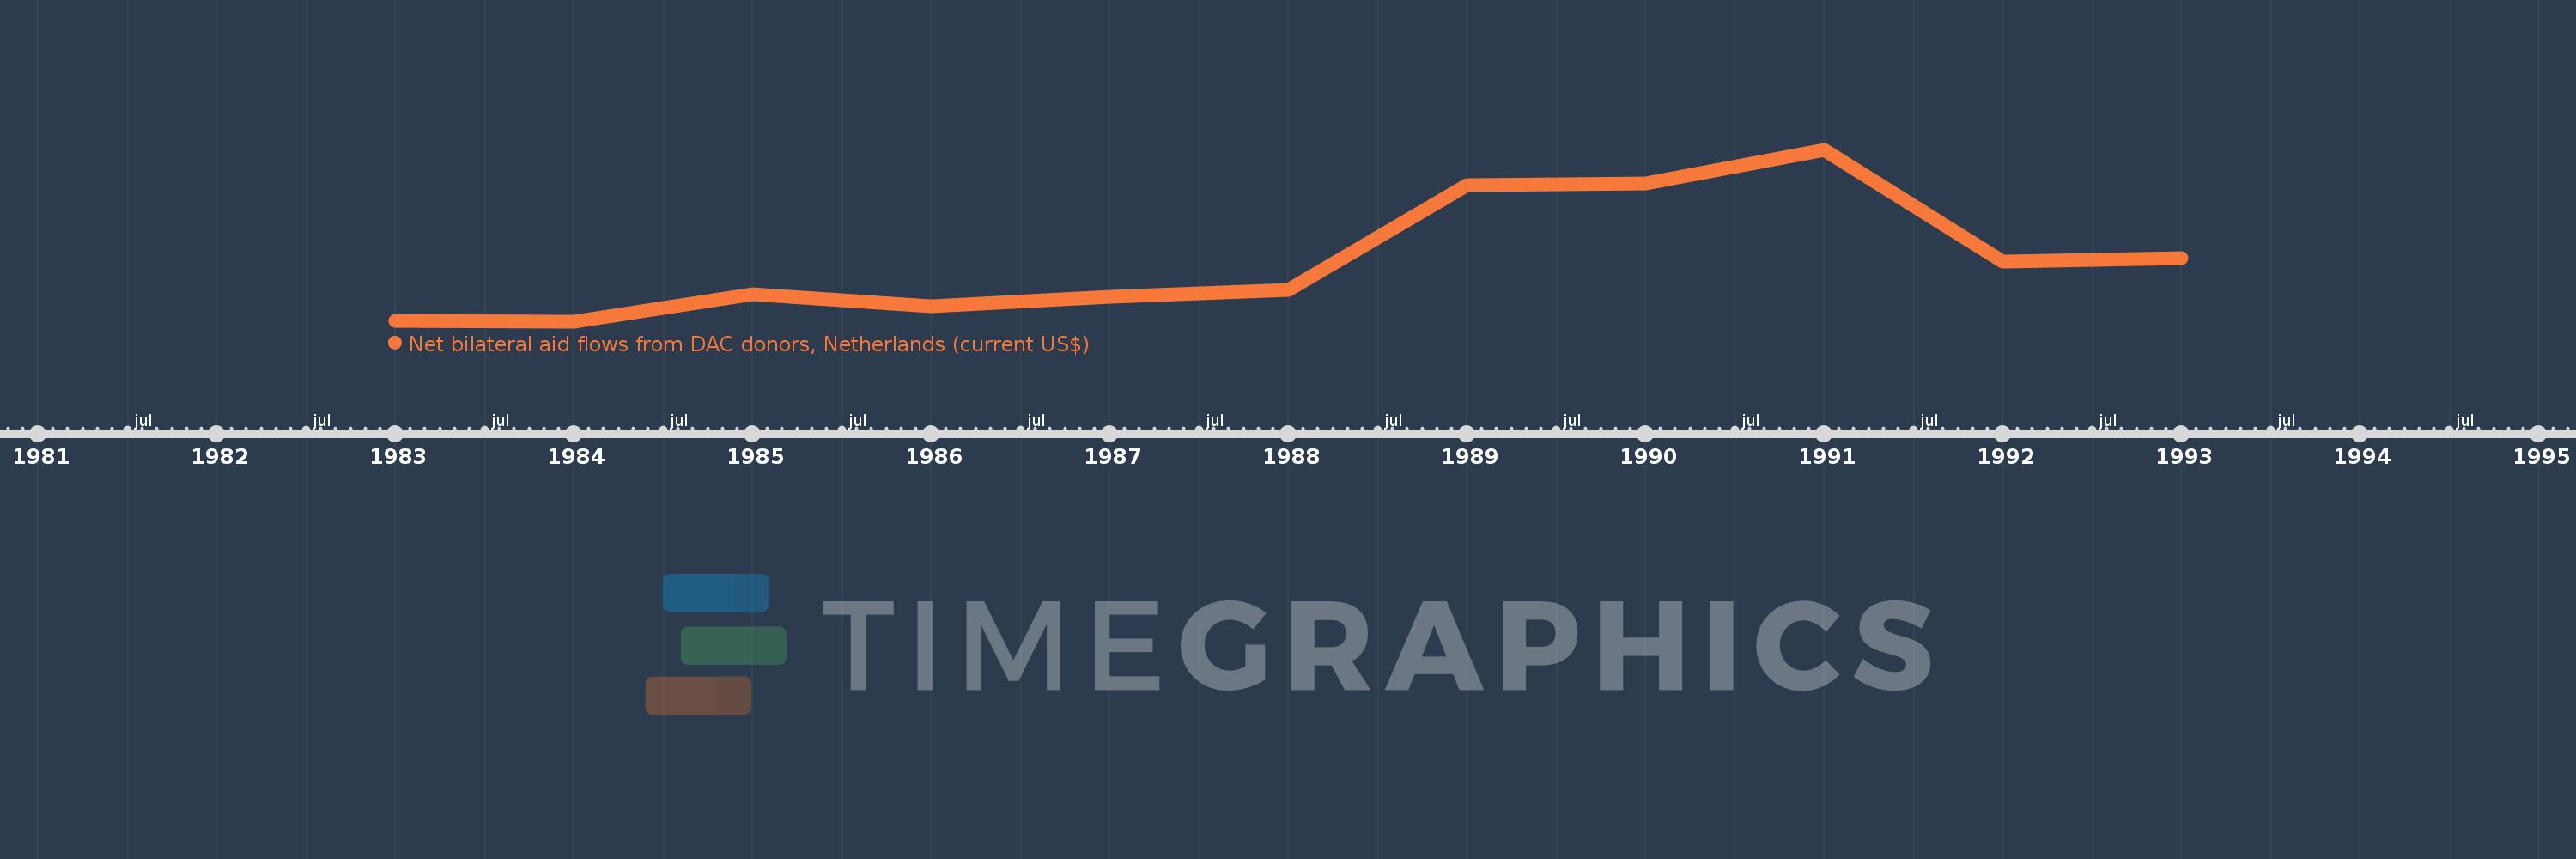
This timeline shows a graph from 1983 to 1993 of Northern Mariana Islands. No data until 1982. Number of actual observations by date: 11.
Source name:
World Development Indicators
Source organization:
Development Assistance Committee of the Organisation for Economic Co-operation and Development, Geographical Distribution of Financial Flows to Developing Countries, Development Co-operation Report, and International Development Statistics database. Data are available online at: www.oecd.org/dac/stats/idsonline.
Categories, topics:
Aid Effectiveness
Last updated:
apr 23, 2017
Indicators value changes by year
Meaning:
498.182K
Minimum:
60.0K
jan 1, 1984
Maximum:
1.29 mln
jan 1, 1991
At the date of observation
Value
Absolute change
Change from the previous value
jan 1, 1983
70.0K
+70.0K
0.0%
jan 1, 1984
60.0K
-10.0K
-14.29%
jan 1, 1985
260.0K
+200.0K
333.33%
jan 1, 1986
170.0K
-90.0K
-34.62%
jan 1, 1987
240.0K
+70.0K
41.18%
jan 1, 1988
290.0K
+50.0K
20.83%
jan 1, 1989
1.04 mln
+750.0K
258.62%
jan 1, 1990
1.05 mln
+10.0K
0.96%
jan 1, 1991
1.29 mln
+240.0K
22.86%
jan 1, 1992
490.0K
-800.0K
-62.02%
jan 1, 1993
520.0K
+30.0K
6.12%
Ranking of countries by current statistics by years