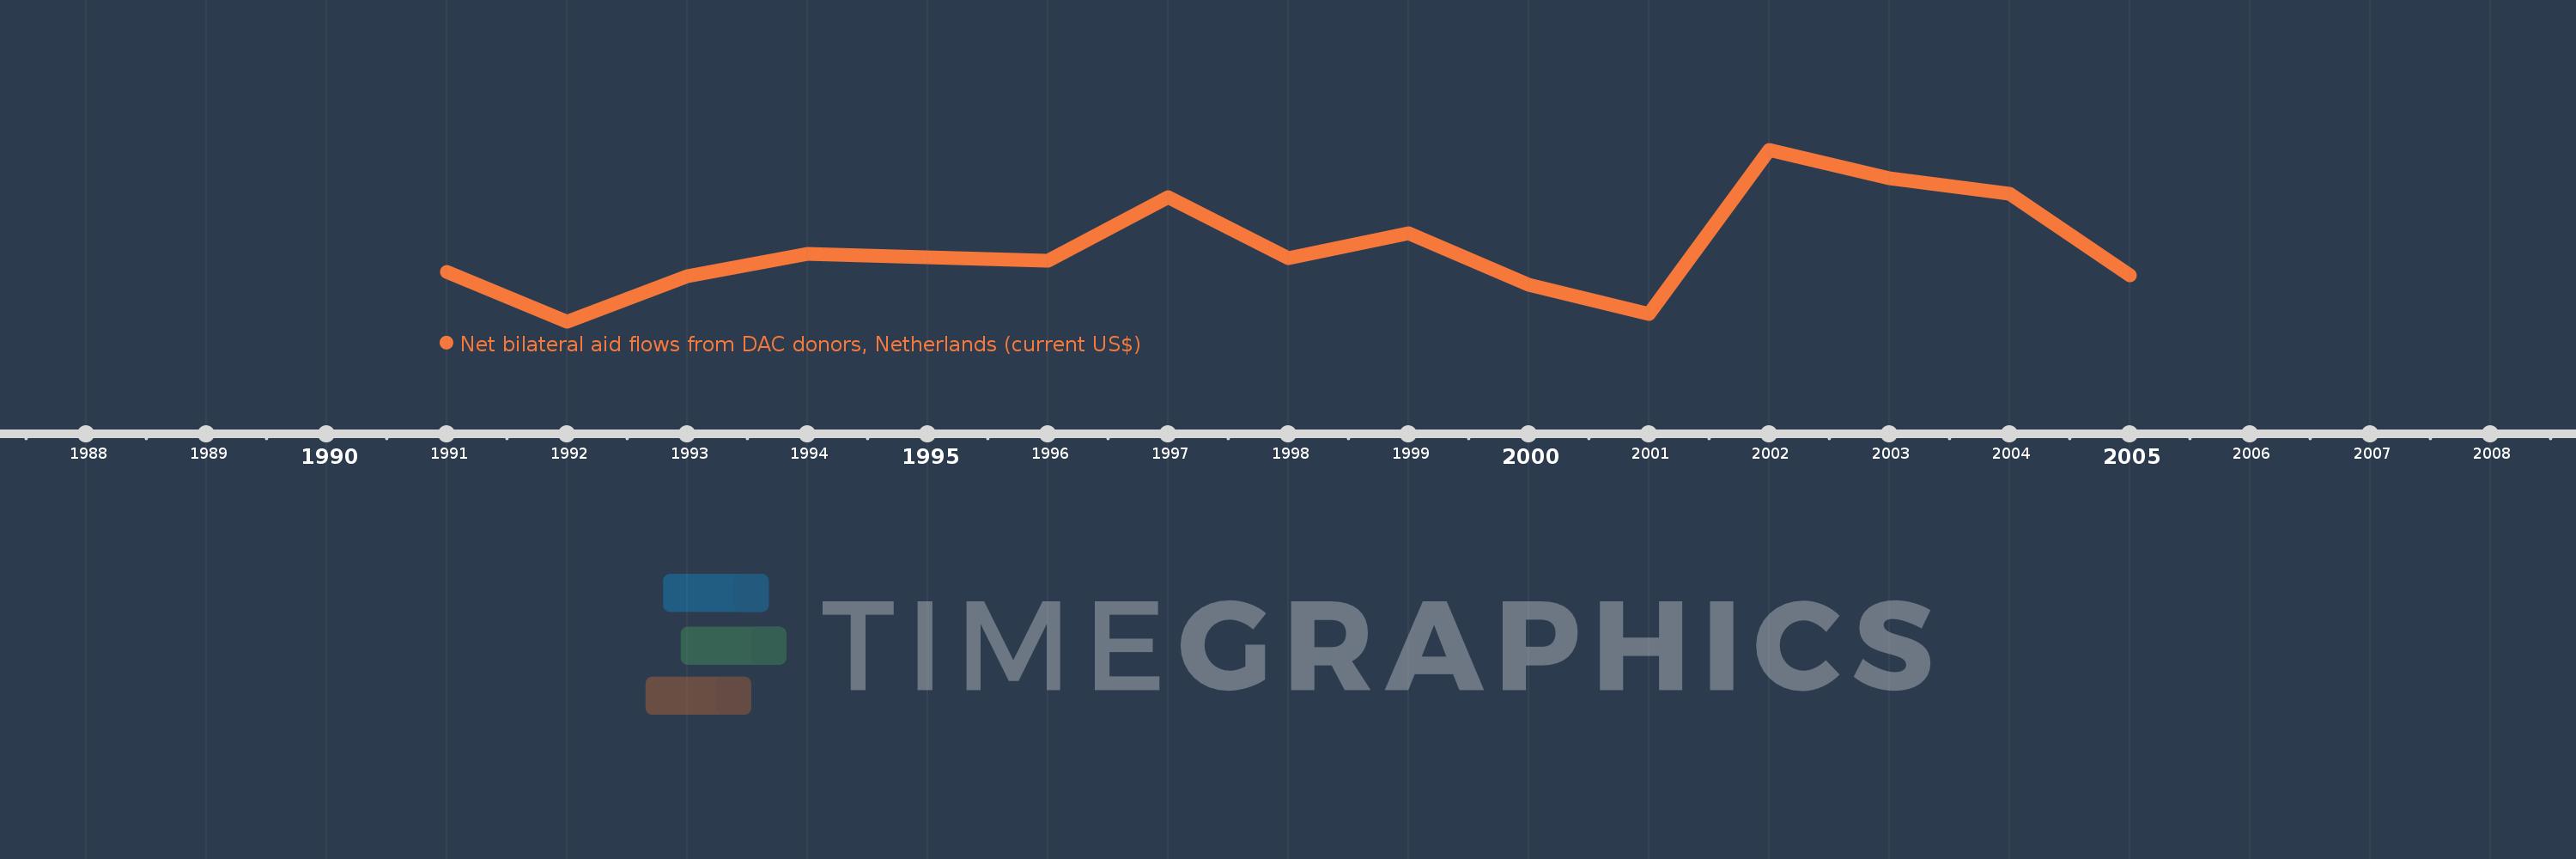
This timeline shows a graph from 1991 to 2005 of Romania. No data until 1990. Number of actual observations by date: 14.
Source name:
World Development Indicators
Source organization:
Development Assistance Committee of the Organisation for Economic Co-operation and Development, Geographical Distribution of Financial Flows to Developing Countries, Development Co-operation Report, and International Development Statistics database. Data are available online at: www.oecd.org/dac/stats/idsonline.
Categories, topics:
Aid Effectiveness
Last updated:
apr 23, 2017
Indicators value changes by year
Meaning:
3.591 mln
Minimum:
200.0K
jan 1, 1992
Maximum:
8.06 mln
jan 1, 2002
At the date of observation
Value
Absolute change
Change from the previous value
jan 1, 1991
2.5 mln
+2.5 mln
0.0%
jan 1, 1992
200.0K
-2.3 mln
-92.0%
jan 1, 1993
2.3 mln
+2.1 mln
1.05K%
jan 1, 1994
3.32 mln
+1.02 mln
44.35%
jan 1, 1996
2.99 mln
-330.0K
-9.94%
jan 1, 1997
5.9 mln
+2.91 mln
97.32%
jan 1, 1998
3.11 mln
-2.79 mln
-47.29%
jan 1, 1999
4.26 mln
+1.15 mln
36.98%
jan 1, 2000
1.89 mln
-2.37 mln
-55.63%
jan 1, 2001
570.0K
-1.32 mln
-69.84%
jan 1, 2002
8.06 mln
+7.49 mln
1.31K%
jan 1, 2003
6.77 mln
-1.29 mln
-16.0%
jan 1, 2004
6.08 mln
-690.0K
-10.19%
jan 1, 2005
2.32 mln
-3.76 mln
-61.84%
Ranking of countries by current statistics by years