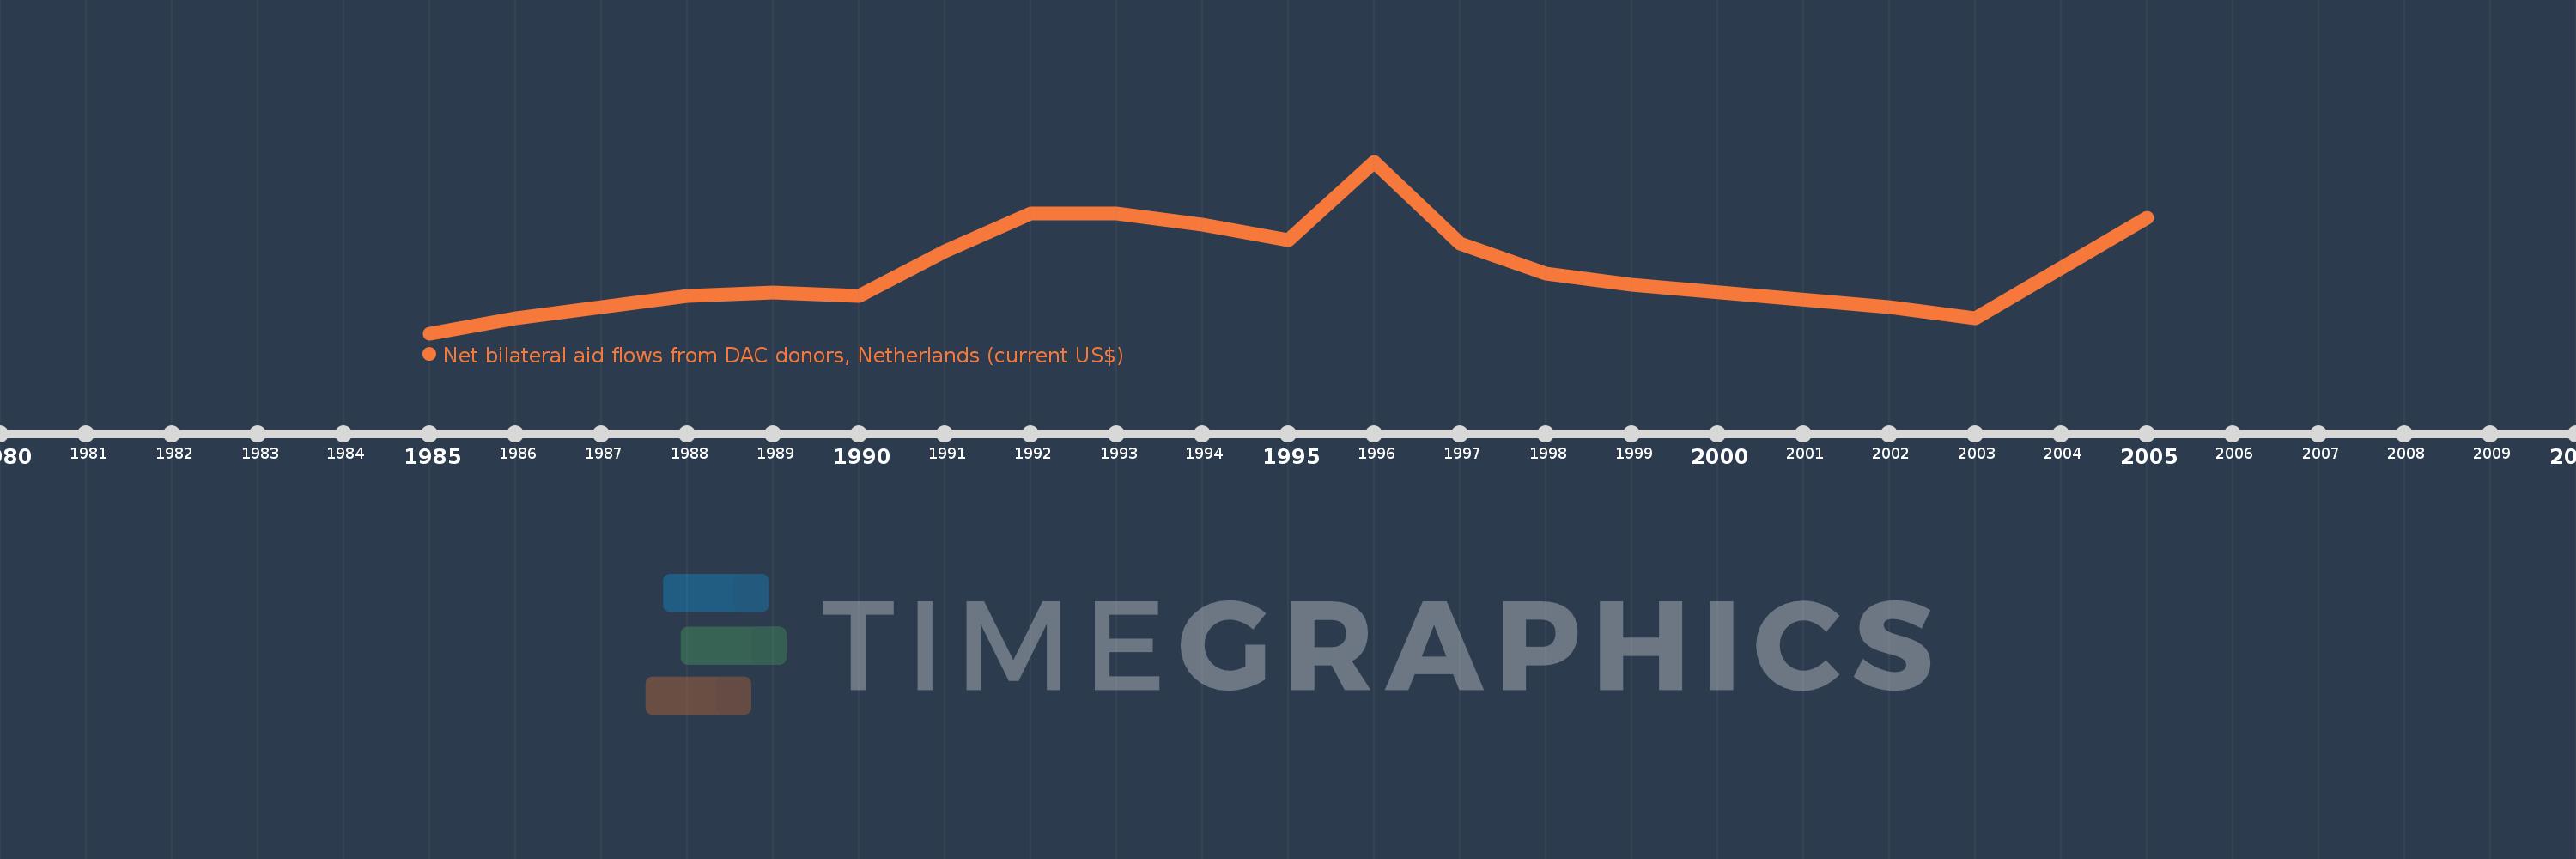
This timeline shows a graph from 1985 to 2005 of Grenada. No data until 1984. Number of actual observations by date: 18.
Source name:
World Development Indicators
Source organization:
Development Assistance Committee of the Organisation for Economic Co-operation and Development, Geographical Distribution of Financial Flows to Developing Countries, Development Co-operation Report, and International Development Statistics database. Data are available online at: www.oecd.org/dac/stats/idsonline.
Categories, topics:
Aid Effectiveness
Last updated:
apr 23, 2017
Indicators value changes by year
Meaning:
189.444K
Minimum:
10.0K
jan 1, 1985
Maximum:
470.0K
jan 1, 1996
At the date of observation
Value
Absolute change
Change from the previous value
jan 1, 1985
10.0K
+10.0K
0.0%
jan 1, 1986
50.0K
+40.0K
400.0%
jan 1, 1987
80.0K
+30.0K
60.0%
jan 1, 1988
110.0K
+30.0K
37.5%
jan 1, 1989
120.0K
+10.0K
9.09%
jan 1, 1990
110.0K
-10.0K
-8.33%
jan 1, 1991
230.0K
+120.0K
109.09%
jan 1, 1992
330.0K
+100.0K
43.48%
jan 1, 1993
330.0K
0.0
0.0%
jan 1, 1994
300.0K
-30.0K
-9.09%
jan 1, 1995
260.0K
-40.0K
-13.33%
jan 1, 1996
470.0K
+210.0K
80.77%
jan 1, 1997
250.0K
-220.0K
-46.81%
jan 1, 1998
170.0K
-80.0K
-32.0%
jan 1, 1999
140.0K
-30.0K
-17.65%
jan 1, 2002
80.0K
-60.0K
-42.86%
jan 1, 2003
50.0K
-30.0K
-37.5%
jan 1, 2005
320.0K
+270.0K
540.0%
Ranking of countries by current statistics by years