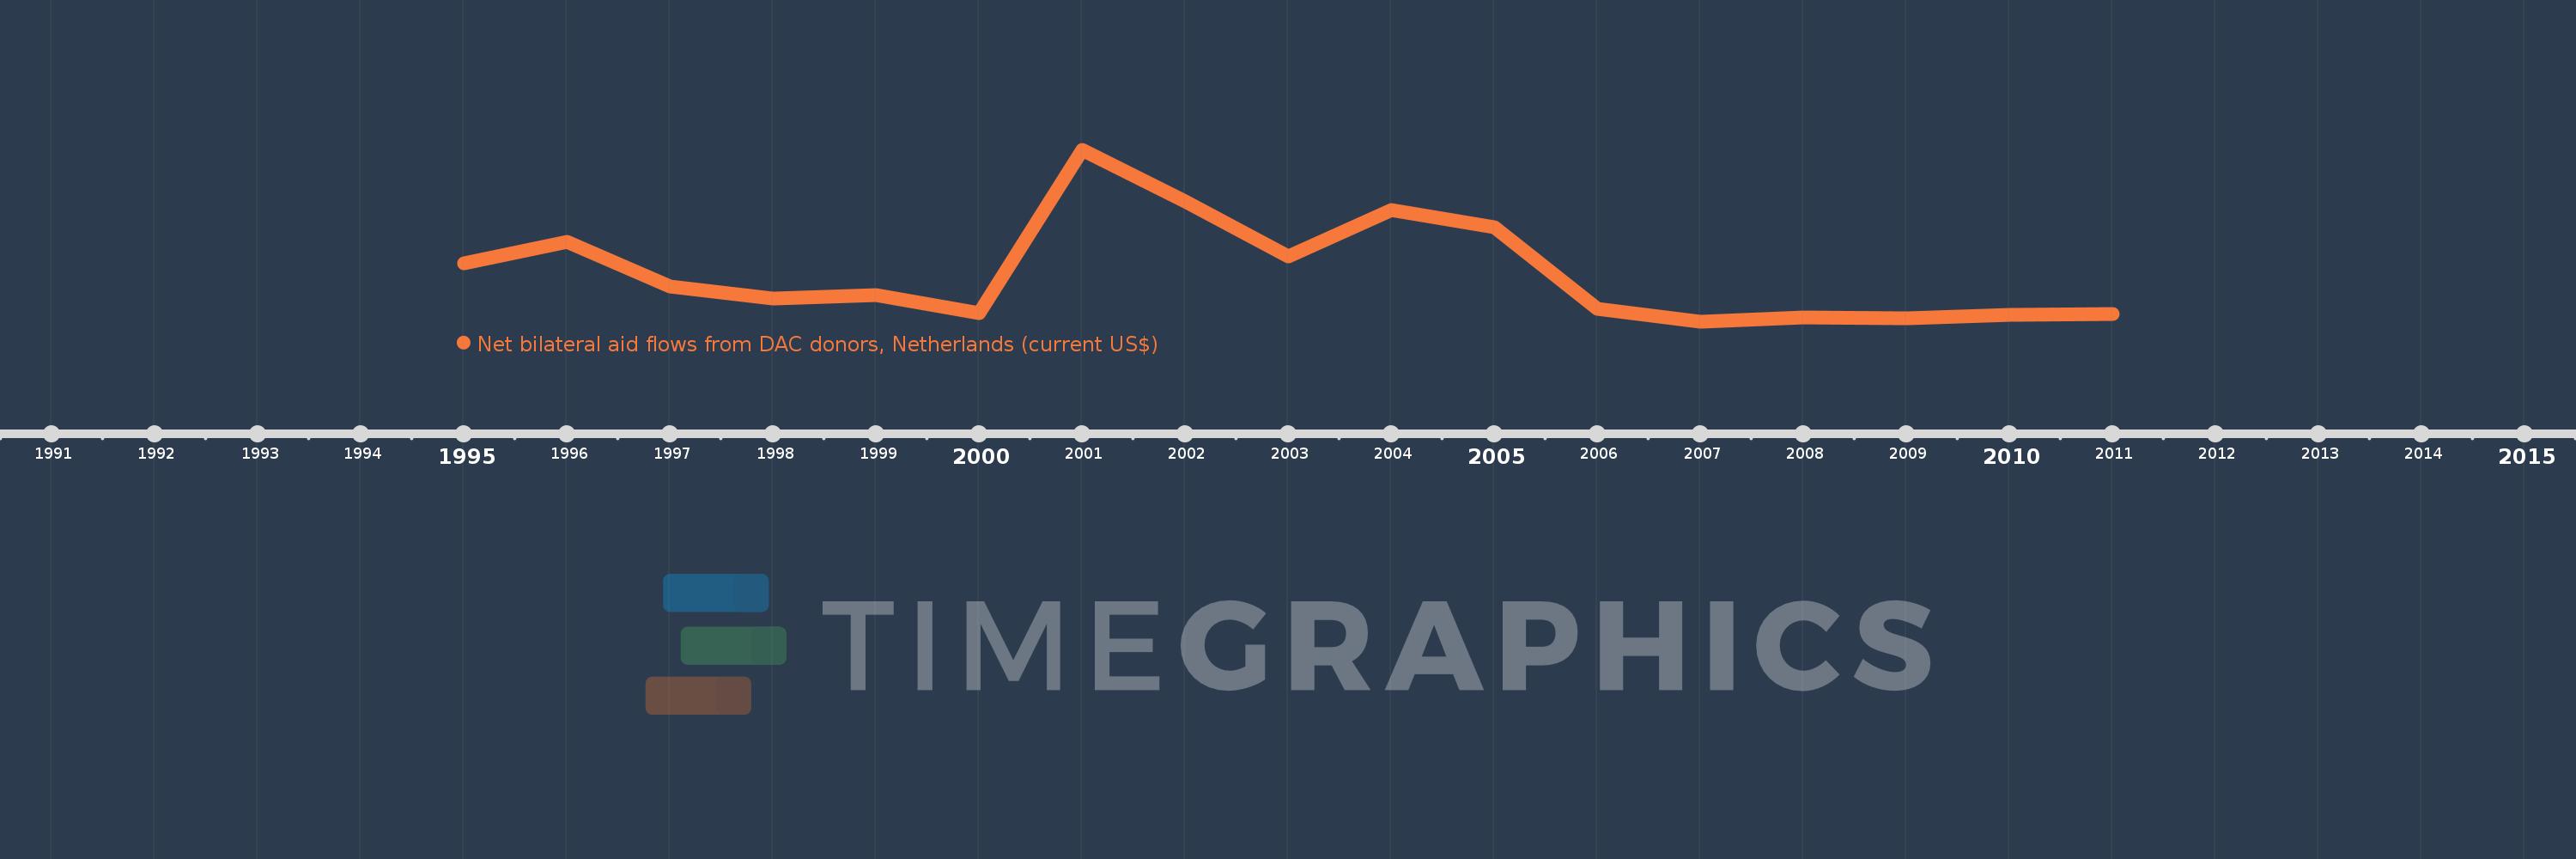
This timeline shows a graph from 1995 to 2011 of Croatia. No data until 1994. Number of actual observations by date: 17.
Source name:
World Development Indicators
Source organization:
Development Assistance Committee of the Organisation for Economic Co-operation and Development, Geographical Distribution of Financial Flows to Developing Countries, Development Co-operation Report, and International Development Statistics database. Data are available online at: www.oecd.org/dac/stats/idsonline.
Categories, topics:
Aid Effectiveness
Last updated:
apr 23, 2017
Indicators value changes by year
Meaning:
1.222 mln
Minimum:
20.0K
jan 1, 2007
Maximum:
4.22 mln
jan 1, 2001
At the date of observation
Value
Absolute change
Change from the previous value
jan 1, 1995
1.46 mln
+1.46 mln
0.0%
jan 1, 1996
1.98 mln
+520.0K
35.62%
jan 1, 1997
880.0K
-1.1 mln
-55.56%
jan 1, 1998
600.0K
-280.0K
-31.82%
jan 1, 1999
680.0K
+80.0K
13.33%
jan 1, 2000
240.0K
-440.0K
-64.71%
jan 1, 2001
4.22 mln
+3.98 mln
1.66K%
jan 1, 2002
2.96 mln
-1.26 mln
-29.86%
jan 1, 2003
1.62 mln
-1.34 mln
-45.27%
jan 1, 2004
2.76 mln
+1.14 mln
70.37%
jan 1, 2005
2.33 mln
-430.0K
-15.58%
jan 1, 2006
340.0K
-1.99 mln
-85.41%
jan 1, 2007
20.0K
-320.0K
-94.12%
jan 1, 2008
140.0K
+120.0K
600.0%
jan 1, 2009
120.0K
-20.0K
-14.29%
jan 1, 2010
200.0K
+80.0K
66.67%
jan 1, 2011
220.0K
+20.0K
10.0%
Ranking of countries by current statistics by years