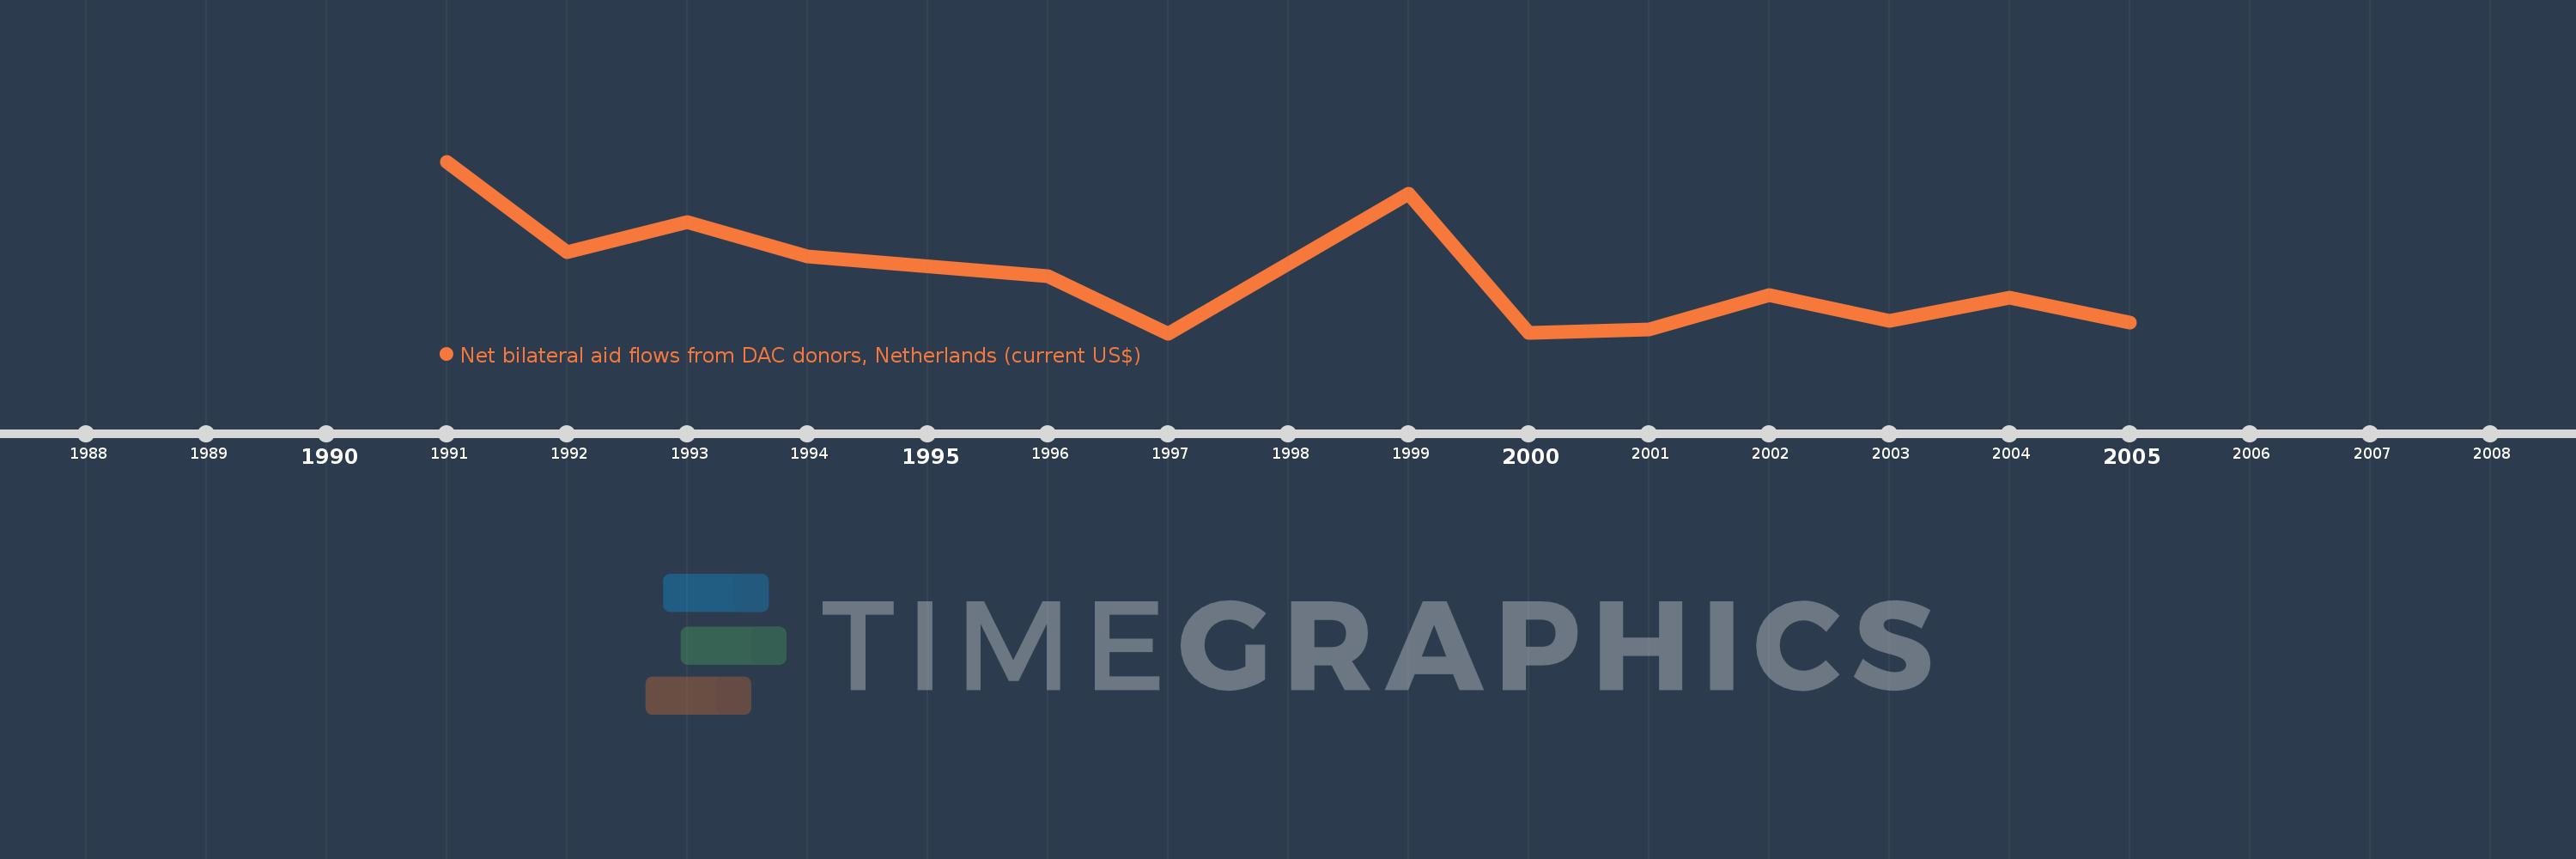
This timeline shows a graph from 1991 to 2005 of Poland. No data until 1990. Number of actual observations by date: 13.
Source name:
World Development Indicators
Source organization:
Development Assistance Committee of the Organisation for Economic Co-operation and Development, Geographical Distribution of Financial Flows to Developing Countries, Development Co-operation Report, and International Development Statistics database. Data are available online at: www.oecd.org/dac/stats/idsonline.
Categories, topics:
Aid Effectiveness
Last updated:
apr 23, 2017
Indicators value changes by year
Meaning:
3.745 mln
Minimum:
360.0K
jan 1, 1997
Maximum:
10.6 mln
jan 1, 1991
At the date of observation
Value
Absolute change
Change from the previous value
jan 1, 1991
10.6 mln
+10.6 mln
0.0%
jan 1, 1992
5.2 mln
-5.4 mln
-50.94%
jan 1, 1993
7.0 mln
+1.8 mln
34.62%
jan 1, 1994
4.94 mln
-2.06 mln
-29.43%
jan 1, 1996
3.75 mln
-1.19 mln
-24.09%
jan 1, 1997
360.0K
-3.39 mln
-90.4%
jan 1, 1999
8.66 mln
+8.3 mln
2.31K%
jan 1, 2000
390.0K
-8.27 mln
-95.5%
jan 1, 2001
580.0K
+190.0K
48.72%
jan 1, 2002
2.65 mln
+2.07 mln
356.9%
jan 1, 2003
1.09 mln
-1.56 mln
-58.87%
jan 1, 2004
2.46 mln
+1.37 mln
125.69%
jan 1, 2005
1.01 mln
-1.45 mln
-58.94%
Ranking of countries by current statistics by years