33
/
AIzaSyAYiBZKx7MnpbEhh9jyipgxe19OcubqV5w
May 1, 2025
180198
Libya
LBY
true
2
1
Net bilateral aid flows from DAC donors, Netherlands (current US$)
2015,2014,2013,2012,2011,2006,2005,2004,2003,2002,1998,1997,1996,1983,1979,1978,1976,1975,1974,1973
Download
Global statistics library →Libya →

Net bilateral aid flows from DAC donors, Netherlands (current US$)

This statistics in other country:

AfghanistanAlbaniaAlgeriaAngolaAntigua and BarbudaArab WorldArgentinaArmeniaArubaAzerbaijanBahamas, TheBahrainBangladeshBarbadosBelarusBelizeBeninBhutanBoliviaBosnia and HerzegovinaBotswanaBrazilBritish Virgin IslandsBrunei DarussalamBulgariaBurkina FasoBurundiCabo VerdeCambodiaCameroonCaribbean small statesCentral African RepublicCentral Europe and the BalticsChadChileChinaColombiaComorosCongo, Dem. Rep.Congo, Rep.Costa RicaCote d'IvoireCroatiaCubaCyprusCzech RepublicDjiboutiDominicaDominican RepublicEast Asia & PacificEast Asia & Pacific (excluding high income)East Asia & Pacific (IDA & IBRD countries)EcuadorEgypt, Arab Rep.El SalvadorEquatorial GuineaEritreaEstoniaEthiopiaEuro areaEurope & Central AsiaEurope & Central Asia (excluding high income)Europe & Central Asia (IDA & IBRD countries)European UnionFijiFragile and conflict affected situationsGabonGambia, TheGeorgiaGhanaGrenadaGuatemalaGuineaGuinea-BissauGuyanaHaitiHeavily indebted poor countries (HIPC)High incomeHondurasHong Kong SAR, ChinaHungaryIBRD onlyIDA & IBRD totalIDA blendIDA onlyIDA totalIndiaIndonesiaIran, Islamic Rep.IraqIsraelJamaicaJordanKazakhstanKenyaKiribatiKorea, Dem. People’s Rep.Korea, Rep.KosovoKuwaitKyrgyz RepublicLao PDRLatin America & Caribbean Latin America & Caribbean (excluding high income)Latin America & the Caribbean (IDA & IBRD countries)LatviaLeast developed countries: UN classificationLebanonLesothoLiberiaLibyaLithuaniaLow & middle incomeLow incomeLower middle incomeMacao SAR, ChinaMacedonia, FYRMadagascarMalawiMalaysiaMaldivesMaliMaltaMauritaniaMauritiusMexicoMicronesia, Fed. Sts.Middle East & North AfricaMiddle East & North Africa (excluding high income)Middle East & North Africa (IDA & IBRD countries)Middle incomeMoldovaMongoliaMontenegroMoroccoMozambiqueMyanmarNamibiaNepalNicaraguaNigerNigeriaNorthern Mariana IslandsOECD membersOmanOther small statesPacific island small statesPakistanPanamaPapua New GuineaParaguayPeruPhilippinesPolandRomaniaRussian FederationRwandaSamoaSao Tome and PrincipeSaudi ArabiaSenegalSerbiaSeychellesSierra LeoneSingaporeSlovak RepublicSloveniaSmall statesSolomon IslandsSomaliaSouth AfricaSouth AsiaSouth Asia (IDA & IBRD)South SudanSri LankaSt. Kitts and NevisSt. LuciaSt. Vincent and the GrenadinesSub-Saharan Africa Sub-Saharan Africa (excluding high income)Sub-Saharan Africa (IDA & IBRD countries)SudanSurinameSwazilandSyrian Arab RepublicTajikistanTanzaniaThailandTimor-LesteTogoTongaTrinidad and TobagoTunisiaTurkeyTurkmenistanTuvaluUgandaUkraineUnited Arab EmiratesUpper middle incomeUruguayUzbekistanVanuatuVenezuela, RBVietnamWest Bank and GazaWorldYemen, Rep.ZambiaZimbabwe

Timeline:

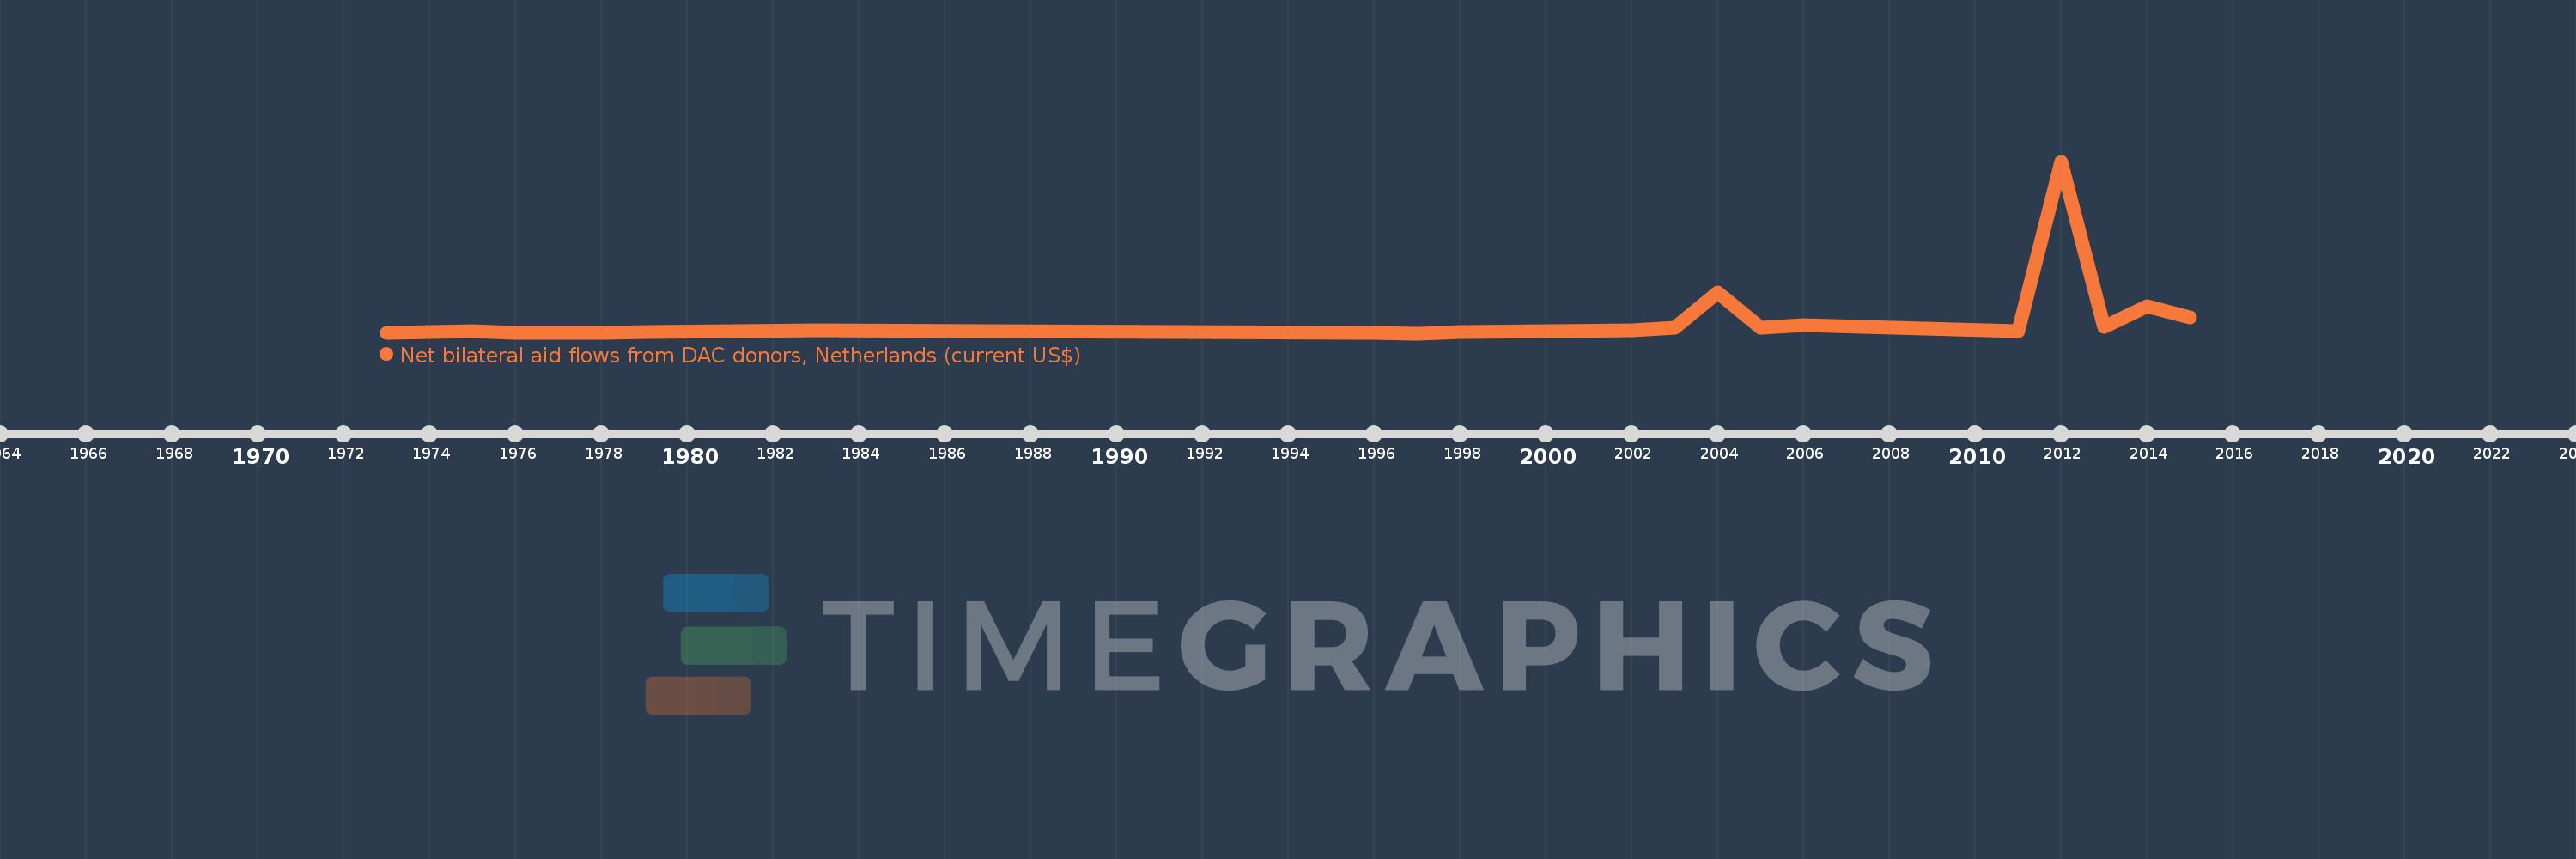
This timeline shows a graph from 1973 to 2015 of Libya. No data until 1972. Number of actual observations by date: 20.

Source name:

World Development Indicators

Source organization:

Development Assistance Committee of the Organisation for Economic Co-operation and Development, Geographical Distribution of Financial Flows to Developing Countries, Development Co-operation Report, and International Development Statistics database. Data are available online at: www.oecd.org/dac/stats/idsonline.

Categories, topics:

Aid Effectiveness

Last updated:

apr 23, 2017

Indicators value changes by year

Meaning:
356.0K
Minimum:
0.0
jan 1, 1997
Maximum:
4.09 mln
jan 1, 2012
At the date of observation
Value
Absolute change
Change from the previous value
jan 1, 1973
20.0K
+20.0K
0.0%
jan 1, 1974
30.0K
+10.0K
50.0%
jan 1, 1975
50.0K
+20.0K
66.67%
jan 1, 1976
20.0K
-30.0K
-60.0%
jan 1, 1978
20.0K
0.0
0.0%
jan 1, 1979
30.0K
+10.0K
50.0%
jan 1, 1983
70.0K
+40.0K
133.33%
jan 1, 1996
10.0K
-60.0K
-85.71%
jan 1, 1997
0.0
-10.0K
-100.0%
jan 1, 1998
30.0K
+30.0K
%
jan 1, 2002
70.0K
+40.0K
133.33%
jan 1, 2003
140.0K
+70.0K
100.0%
jan 1, 2004
970.0K
+830.0K
592.86%
jan 1, 2005
140.0K
-830.0K
-85.57%
jan 1, 2006
200.0K
+60.0K
42.86%
jan 1, 2011
60.0K
-140.0K
-70.0%
jan 1, 2012
4.09 mln
+4.03 mln
6.72K%
jan 1, 2013
150.0K
-3.94 mln
-96.33%
jan 1, 2014
640.0K
+490.0K
326.67%
jan 1, 2015
380.0K
-260.0K
-40.63%

Ranking of countries by current statistics by years