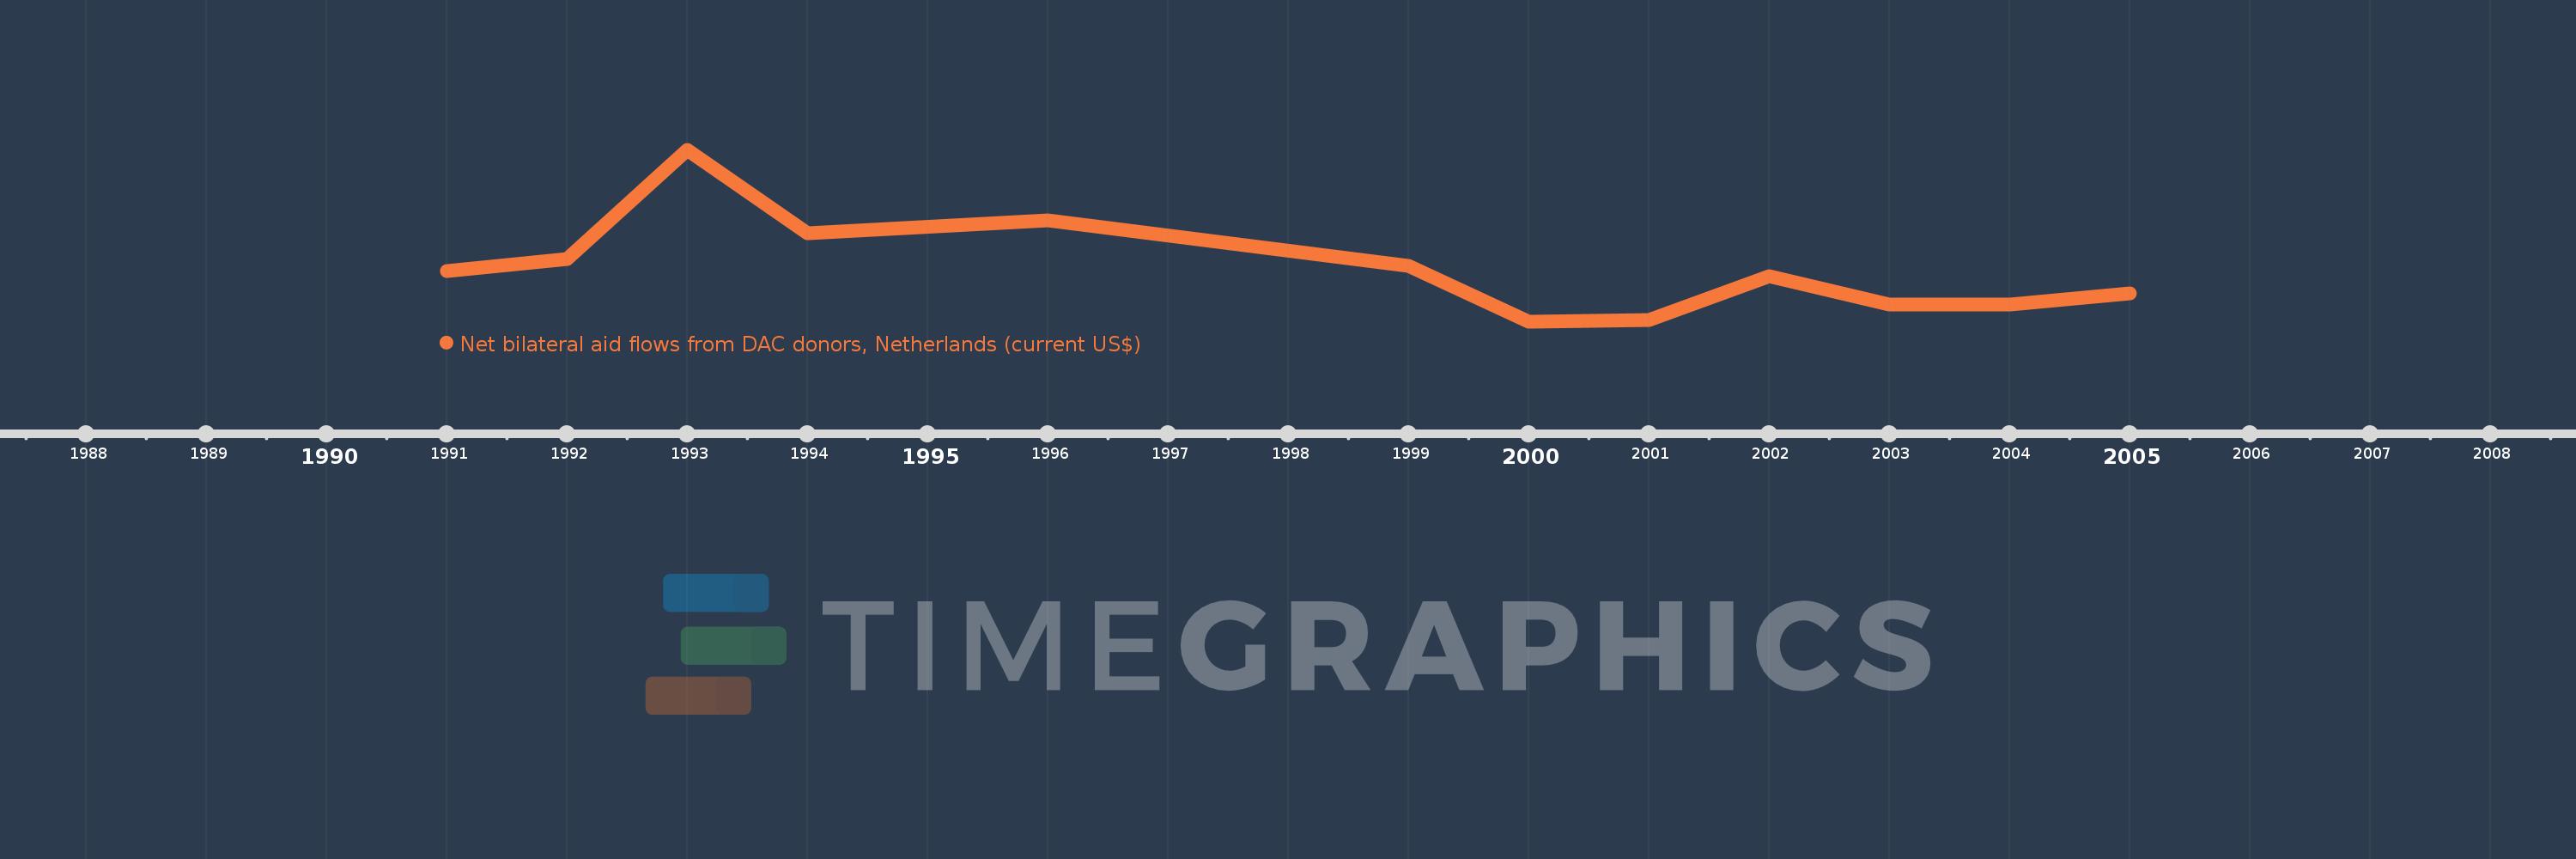
This timeline shows a graph from 1991 to 2005 of Hungary. No data until 1990. Number of actual observations by date: 12.
Source name:
World Development Indicators
Source organization:
Development Assistance Committee of the Organisation for Economic Co-operation and Development, Geographical Distribution of Financial Flows to Developing Countries, Development Co-operation Report, and International Development Statistics database. Data are available online at: www.oecd.org/dac/stats/idsonline.
Categories, topics:
Aid Effectiveness
Last updated:
apr 23, 2017
Indicators value changes by year
Meaning:
3.261 mln
Minimum:
120.0K
jan 1, 2000
Maximum:
10.2 mln
jan 1, 1993
At the date of observation
Value
Absolute change
Change from the previous value
jan 1, 1991
3.1 mln
+3.1 mln
0.0%
jan 1, 1992
3.8 mln
+700.0K
22.58%
jan 1, 1993
10.2 mln
+6.4 mln
168.42%
jan 1, 1994
5.33 mln
-4.87 mln
-47.75%
jan 1, 1996
6.09 mln
+760.0K
14.26%
jan 1, 1999
3.4 mln
-2.69 mln
-44.17%
jan 1, 2000
120.0K
-3.28 mln
-96.47%
jan 1, 2001
220.0K
+100.0K
83.33%
jan 1, 2002
2.81 mln
+2.59 mln
1.18K%
jan 1, 2003
1.16 mln
-1.65 mln
-58.72%
jan 1, 2004
1.12 mln
-40.0K
-3.45%
jan 1, 2005
1.78 mln
+660.0K
58.93%
Ranking of countries by current statistics by years