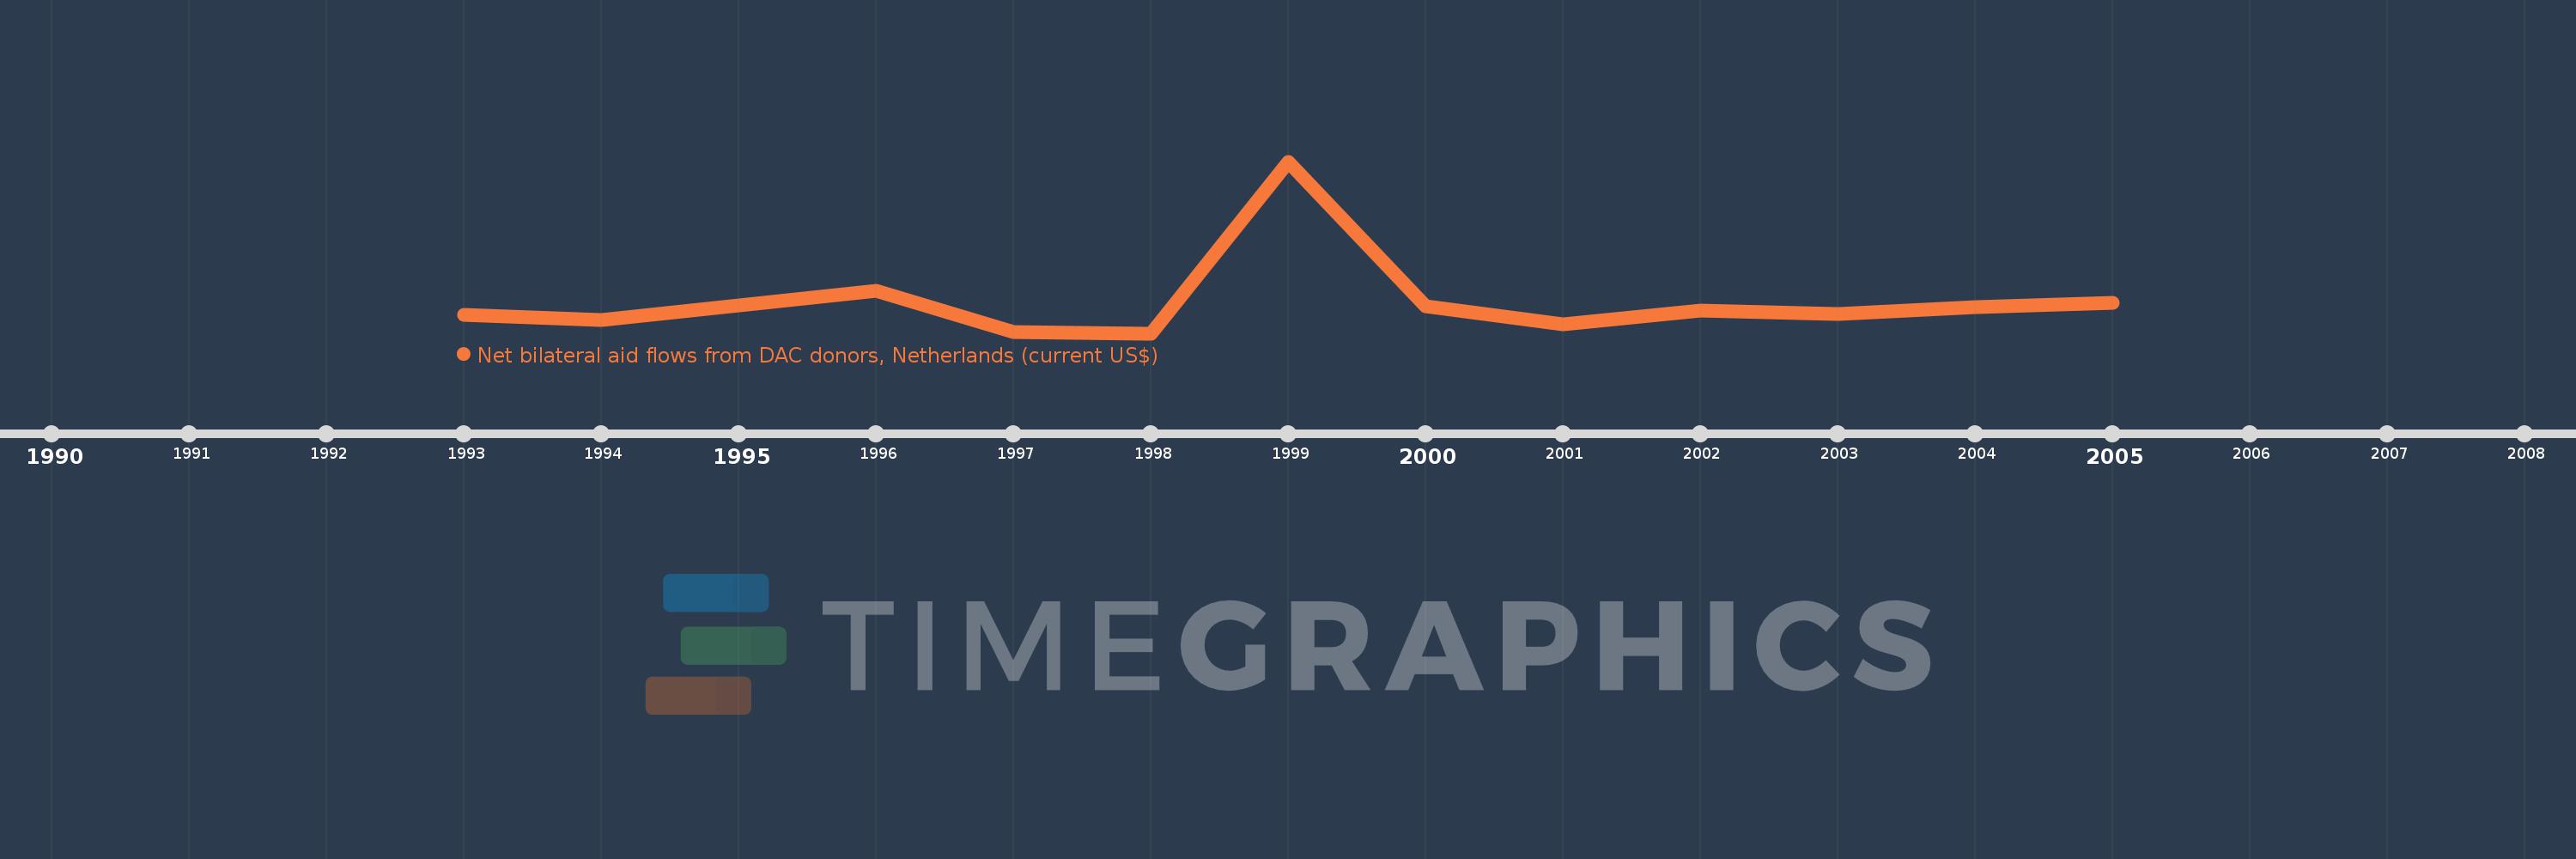
This timeline shows a graph from 1993 to 2005 of Russian Federation. No data until 1992. Number of actual observations by date: 12.
Source name:
World Development Indicators
Source organization:
Development Assistance Committee of the Organisation for Economic Co-operation and Development, Geographical Distribution of Financial Flows to Developing Countries, Development Co-operation Report, and International Development Statistics database. Data are available online at: www.oecd.org/dac/stats/idsonline.
Categories, topics:
Aid Effectiveness
Last updated:
apr 23, 2017
Indicators value changes by year
Meaning:
13.47 mln
Minimum:
360.0K
jan 1, 1998
Maximum:
70.93 mln
jan 1, 1999
At the date of observation
Value
Absolute change
Change from the previous value
jan 1, 1993
7.9 mln
+7.9 mln
0.0%
jan 1, 1994
5.78 mln
-2.12 mln
-26.84%
jan 1, 1996
17.86 mln
+12.08 mln
209.0%
jan 1, 1997
1.04 mln
-16.82 mln
-94.18%
jan 1, 1998
360.0K
-680.0K
-65.38%
jan 1, 1999
70.93 mln
+70.57 mln
19.6K%
jan 1, 2000
11.65 mln
-59.28 mln
-83.58%
jan 1, 2001
4.13 mln
-7.52 mln
-64.55%
jan 1, 2002
9.88 mln
+5.75 mln
139.23%
jan 1, 2003
8.22 mln
-1.66 mln
-16.8%
jan 1, 2004
11.11 mln
+2.89 mln
35.16%
jan 1, 2005
12.78 mln
+1.67 mln
15.03%
Ranking of countries by current statistics by years