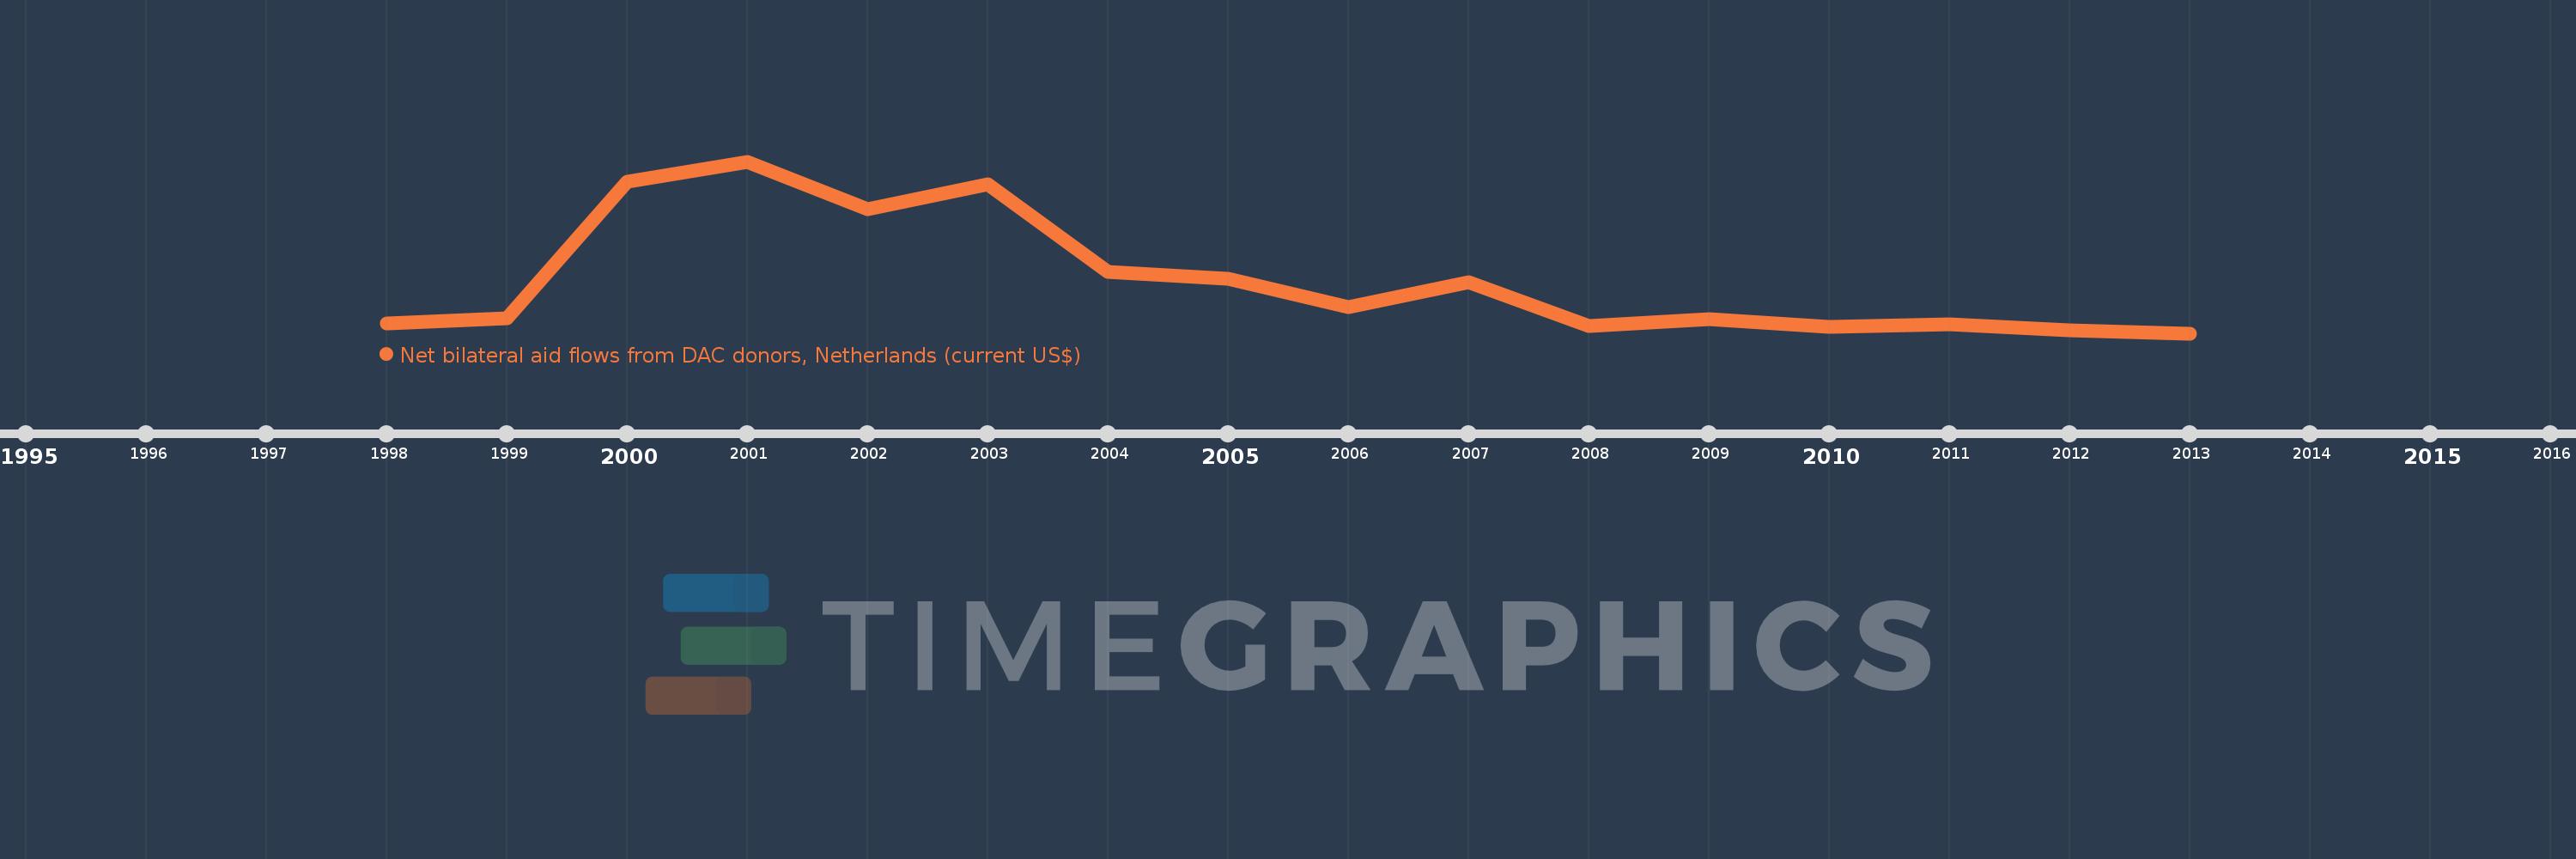
This timeline shows a graph from 1998 to 2013 of Serbia. No data until 1997. Number of actual observations by date: 16.
Source name:
World Development Indicators
Source organization:
Development Assistance Committee of the Organisation for Economic Co-operation and Development, Geographical Distribution of Financial Flows to Developing Countries, Development Co-operation Report, and International Development Statistics database. Data are available online at: www.oecd.org/dac/stats/idsonline.
Categories, topics:
Aid Effectiveness
Last updated:
apr 23, 2017
Indicators value changes by year
Meaning:
22.258 mln
Minimum:
30.0K
jan 1, 2013
Maximum:
71.45 mln
jan 1, 2001
At the date of observation
Value
Absolute change
Change from the previous value
jan 1, 1998
4.28 mln
+4.28 mln
0.0%
jan 1, 1999
6.4 mln
+2.12 mln
49.53%
jan 1, 2000
63.12 mln
+56.72 mln
886.25%
jan 1, 2001
71.45 mln
+8.33 mln
13.2%
jan 1, 2002
51.63 mln
-19.82 mln
-27.74%
jan 1, 2003
61.91 mln
+10.28 mln
19.91%
jan 1, 2004
25.53 mln
-36.38 mln
-58.76%
jan 1, 2005
22.84 mln
-2.69 mln
-10.54%
jan 1, 2006
10.75 mln
-12.09 mln
-52.93%
jan 1, 2007
21.3 mln
+10.55 mln
98.14%
jan 1, 2008
3.11 mln
-18.19 mln
-85.4%
jan 1, 2009
6.06 mln
+2.95 mln
94.86%
jan 1, 2010
2.62 mln
-3.44 mln
-56.77%
jan 1, 2011
3.78 mln
+1.16 mln
44.27%
jan 1, 2012
1.32 mln
-2.46 mln
-65.08%
jan 1, 2013
30.0K
-1.29 mln
-97.73%
Ranking of countries by current statistics by years