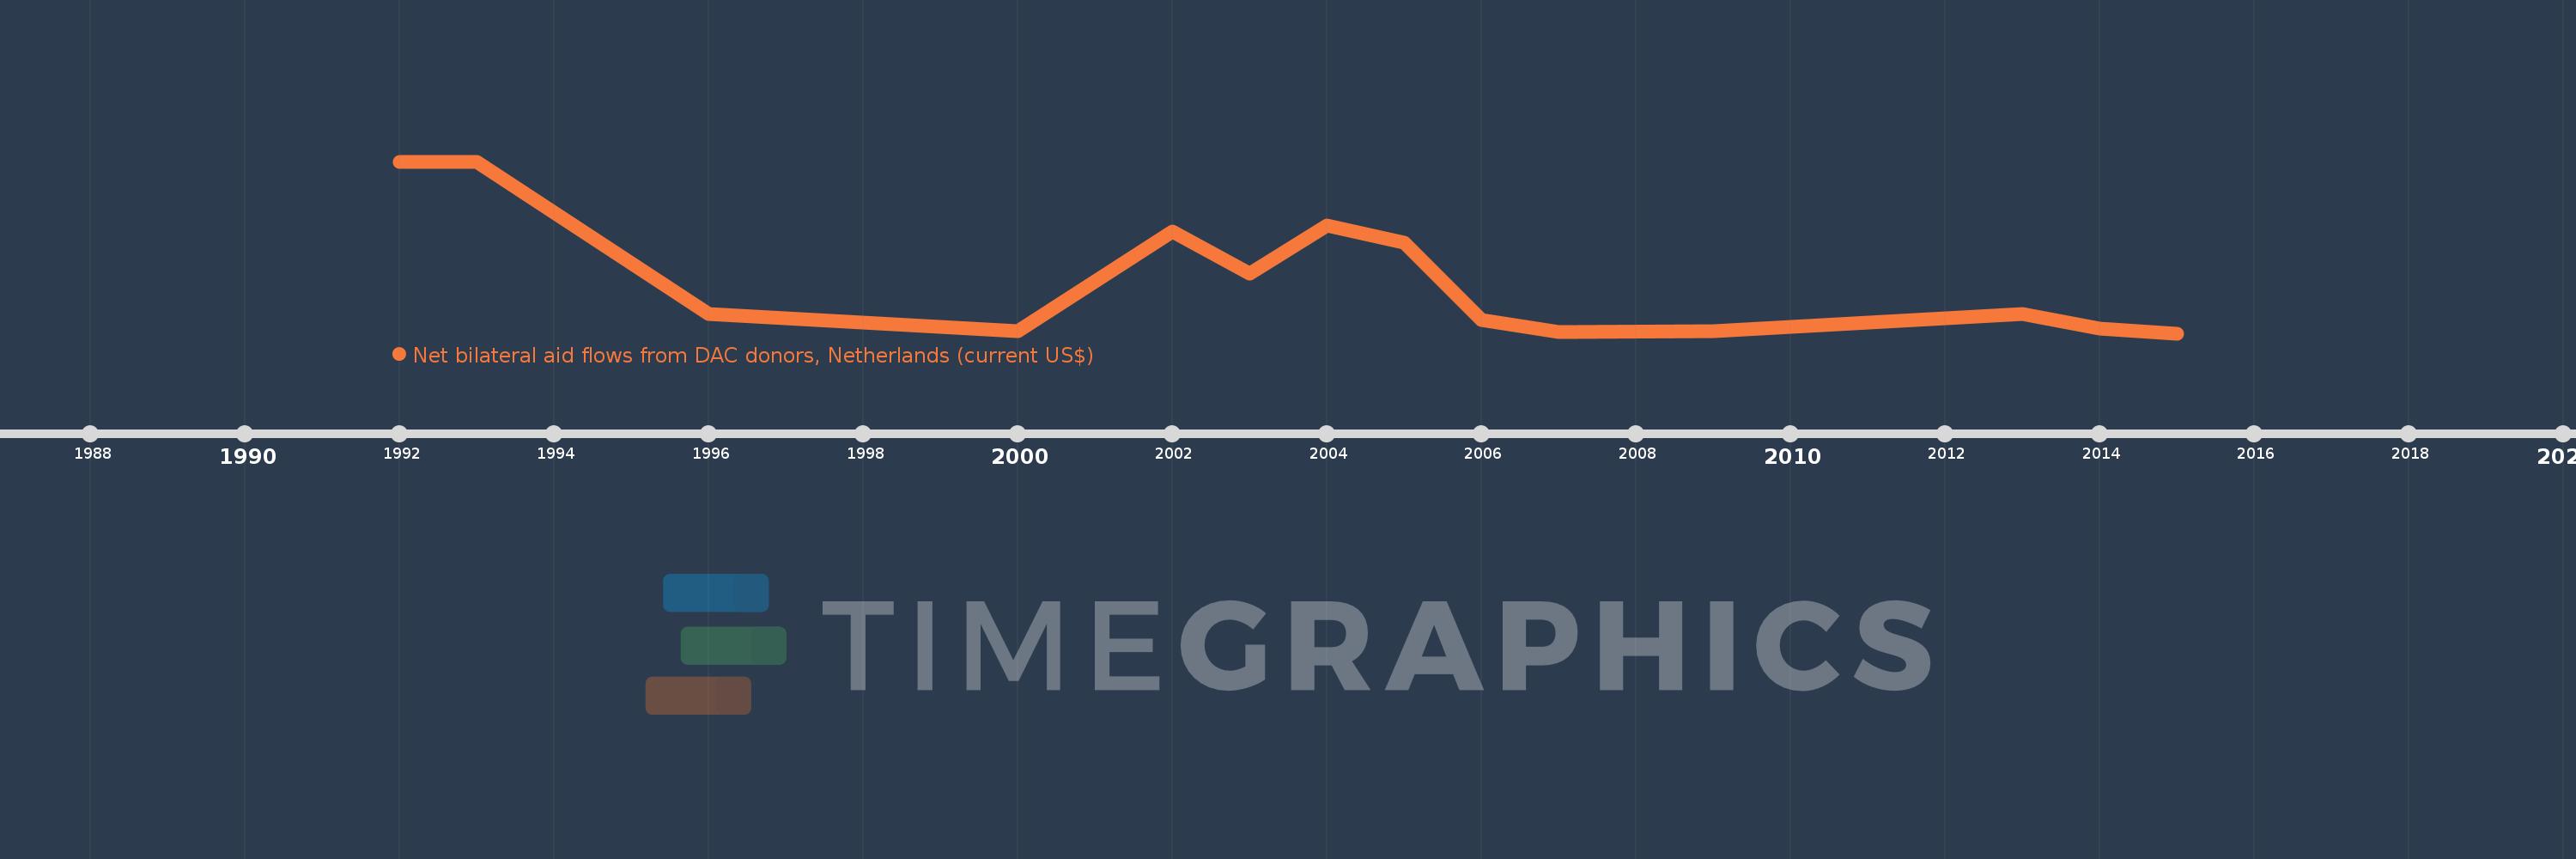
This timeline shows a graph from 1992 to 2015 of Belarus. No data until 1991. Number of actual observations by date: 14.
Source name:
World Development Indicators
Source organization:
Development Assistance Committee of the Organisation for Economic Co-operation and Development, Geographical Distribution of Financial Flows to Developing Countries, Development Co-operation Report, and International Development Statistics database. Data are available online at: www.oecd.org/dac/stats/idsonline.
Categories, topics:
Aid Effectiveness
Last updated:
apr 23, 2017
Indicators value changes by year
Meaning:
928.571K
Minimum:
10.0K
jan 1, 2015
Maximum:
2.9 mln
jan 1, 1992
At the date of observation
Value
Absolute change
Change from the previous value
jan 1, 1992
2.9 mln
+2.9 mln
0.0%
jan 1, 1993
2.9 mln
0.0
0.0%
jan 1, 1996
340.0K
-2.56 mln
-88.28%
jan 1, 2000
40.0K
-300.0K
-88.24%
jan 1, 2002
1.72 mln
+1.68 mln
4.2K%
jan 1, 2003
1.01 mln
-710.0K
-41.28%
jan 1, 2004
1.82 mln
+810.0K
80.2%
jan 1, 2005
1.54 mln
-280.0K
-15.38%
jan 1, 2006
230.0K
-1.31 mln
-85.06%
jan 1, 2007
30.0K
-200.0K
-86.96%
jan 1, 2009
40.0K
+10.0K
33.33%
jan 1, 2013
330.0K
+290.0K
725.0%
jan 1, 2014
90.0K
-240.0K
-72.73%
jan 1, 2015
10.0K
-80.0K
-88.89%
Ranking of countries by current statistics by years