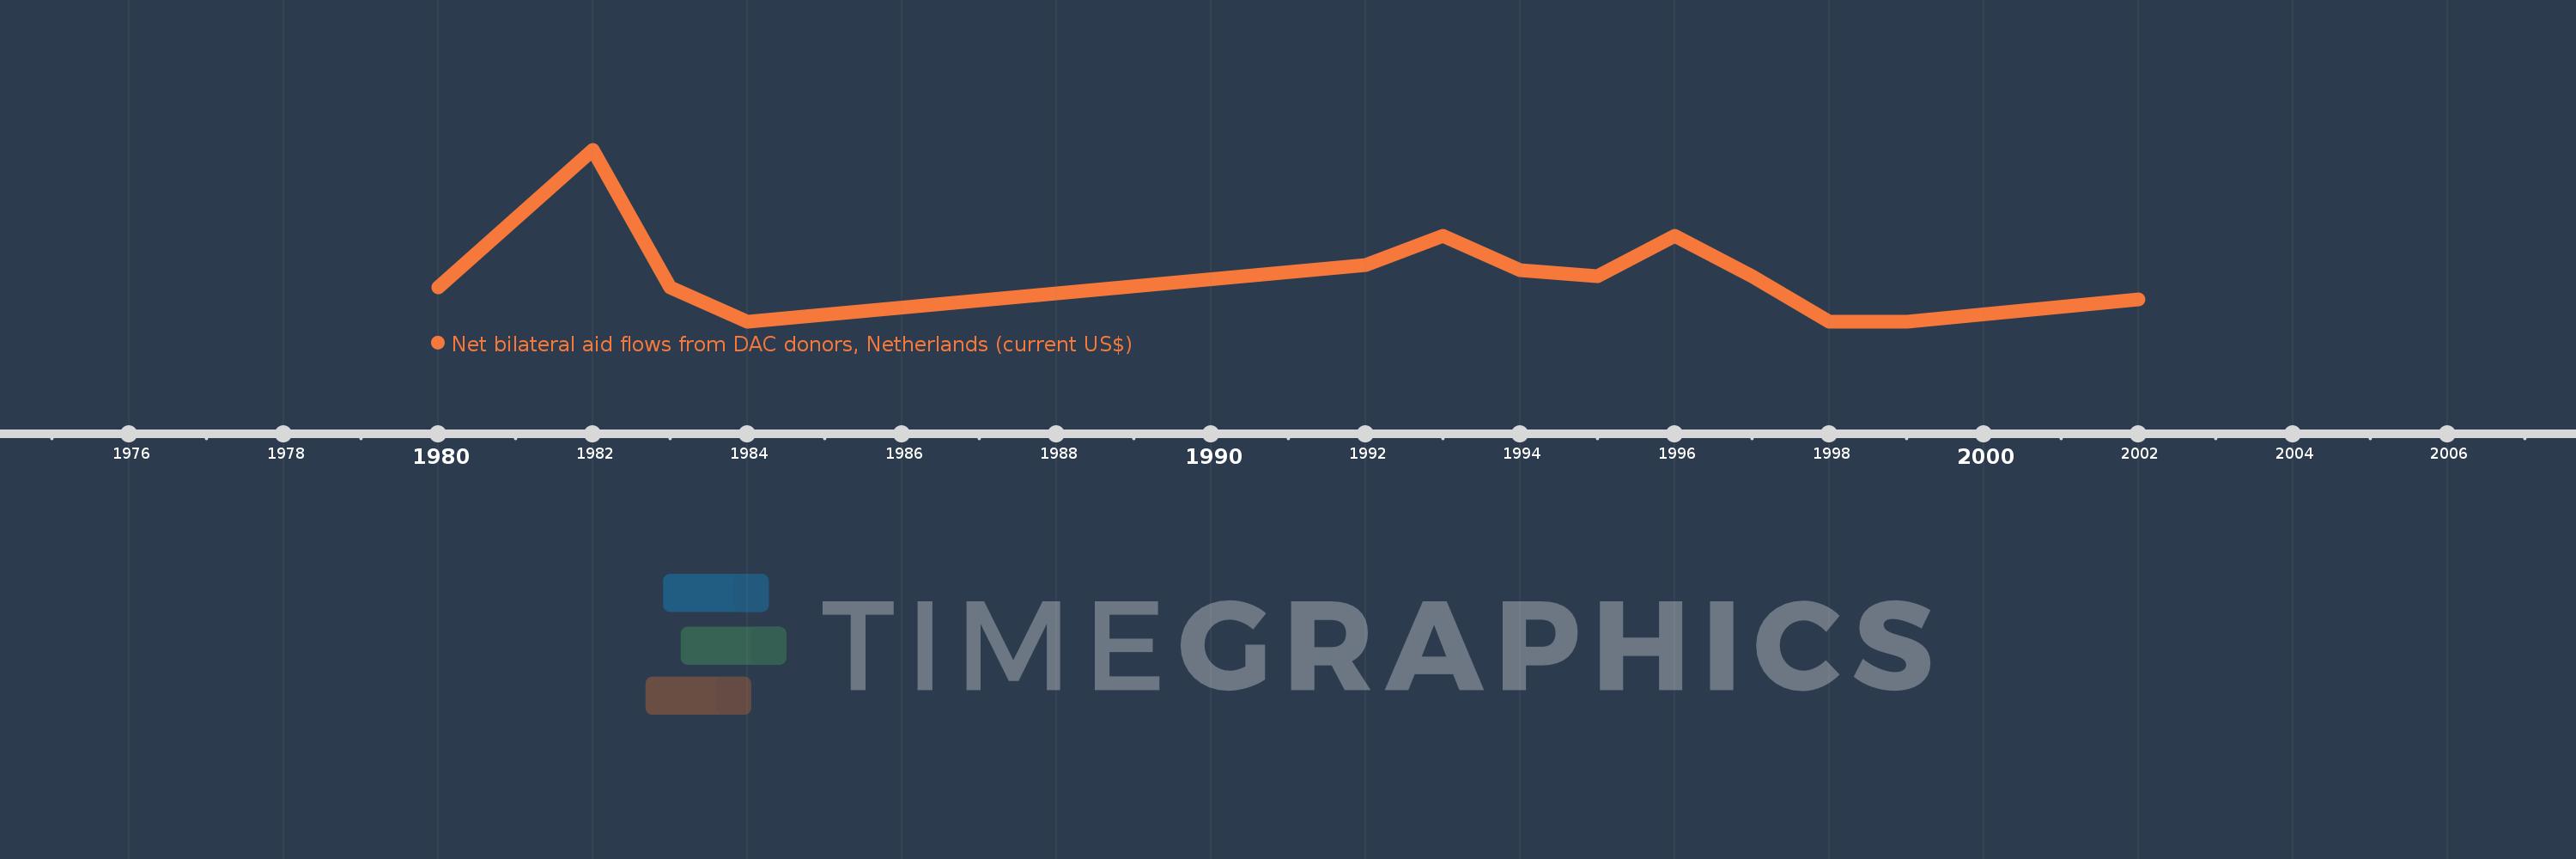
This timeline shows a graph from 1980 to 2002 of St. Vincent and the Grenadines. No data until 1979. Number of actual observations by date: 13.
Source name:
World Development Indicators
Source organization:
Development Assistance Committee of the Organisation for Economic Co-operation and Development, Geographical Distribution of Financial Flows to Developing Countries, Development Co-operation Report, and International Development Statistics database. Data are available online at: www.oecd.org/dac/stats/idsonline.
Categories, topics:
Aid Effectiveness
Last updated:
apr 23, 2017
Indicators value changes by year
Meaning:
95.385K
Minimum:
10.0K
jan 1, 1984
Maximum:
310.0K
jan 1, 1982
At the date of observation
Value
Absolute change
Change from the previous value
jan 1, 1980
70.0K
+70.0K
0.0%
jan 1, 1982
310.0K
+240.0K
342.86%
jan 1, 1983
70.0K
-240.0K
-77.42%
jan 1, 1984
10.0K
-60.0K
-85.71%
jan 1, 1992
110.0K
+100.0K
1000.0%
jan 1, 1993
160.0K
+50.0K
45.45%
jan 1, 1994
100.0K
-60.0K
-37.5%
jan 1, 1995
90.0K
-10.0K
-10.0%
jan 1, 1996
160.0K
+70.0K
77.78%
jan 1, 1997
90.0K
-70.0K
-43.75%
jan 1, 1998
10.0K
-80.0K
-88.89%
jan 1, 1999
10.0K
0.0
0.0%
jan 1, 2002
50.0K
+40.0K
400.0%
Ranking of countries by current statistics by years