33
/
AIzaSyB4mHJ5NPEv-XzF7P6NDYXjlkCWaeKw5bc
November 30, 2025
92617
Brunei Darussalam
BRN
true
2
1
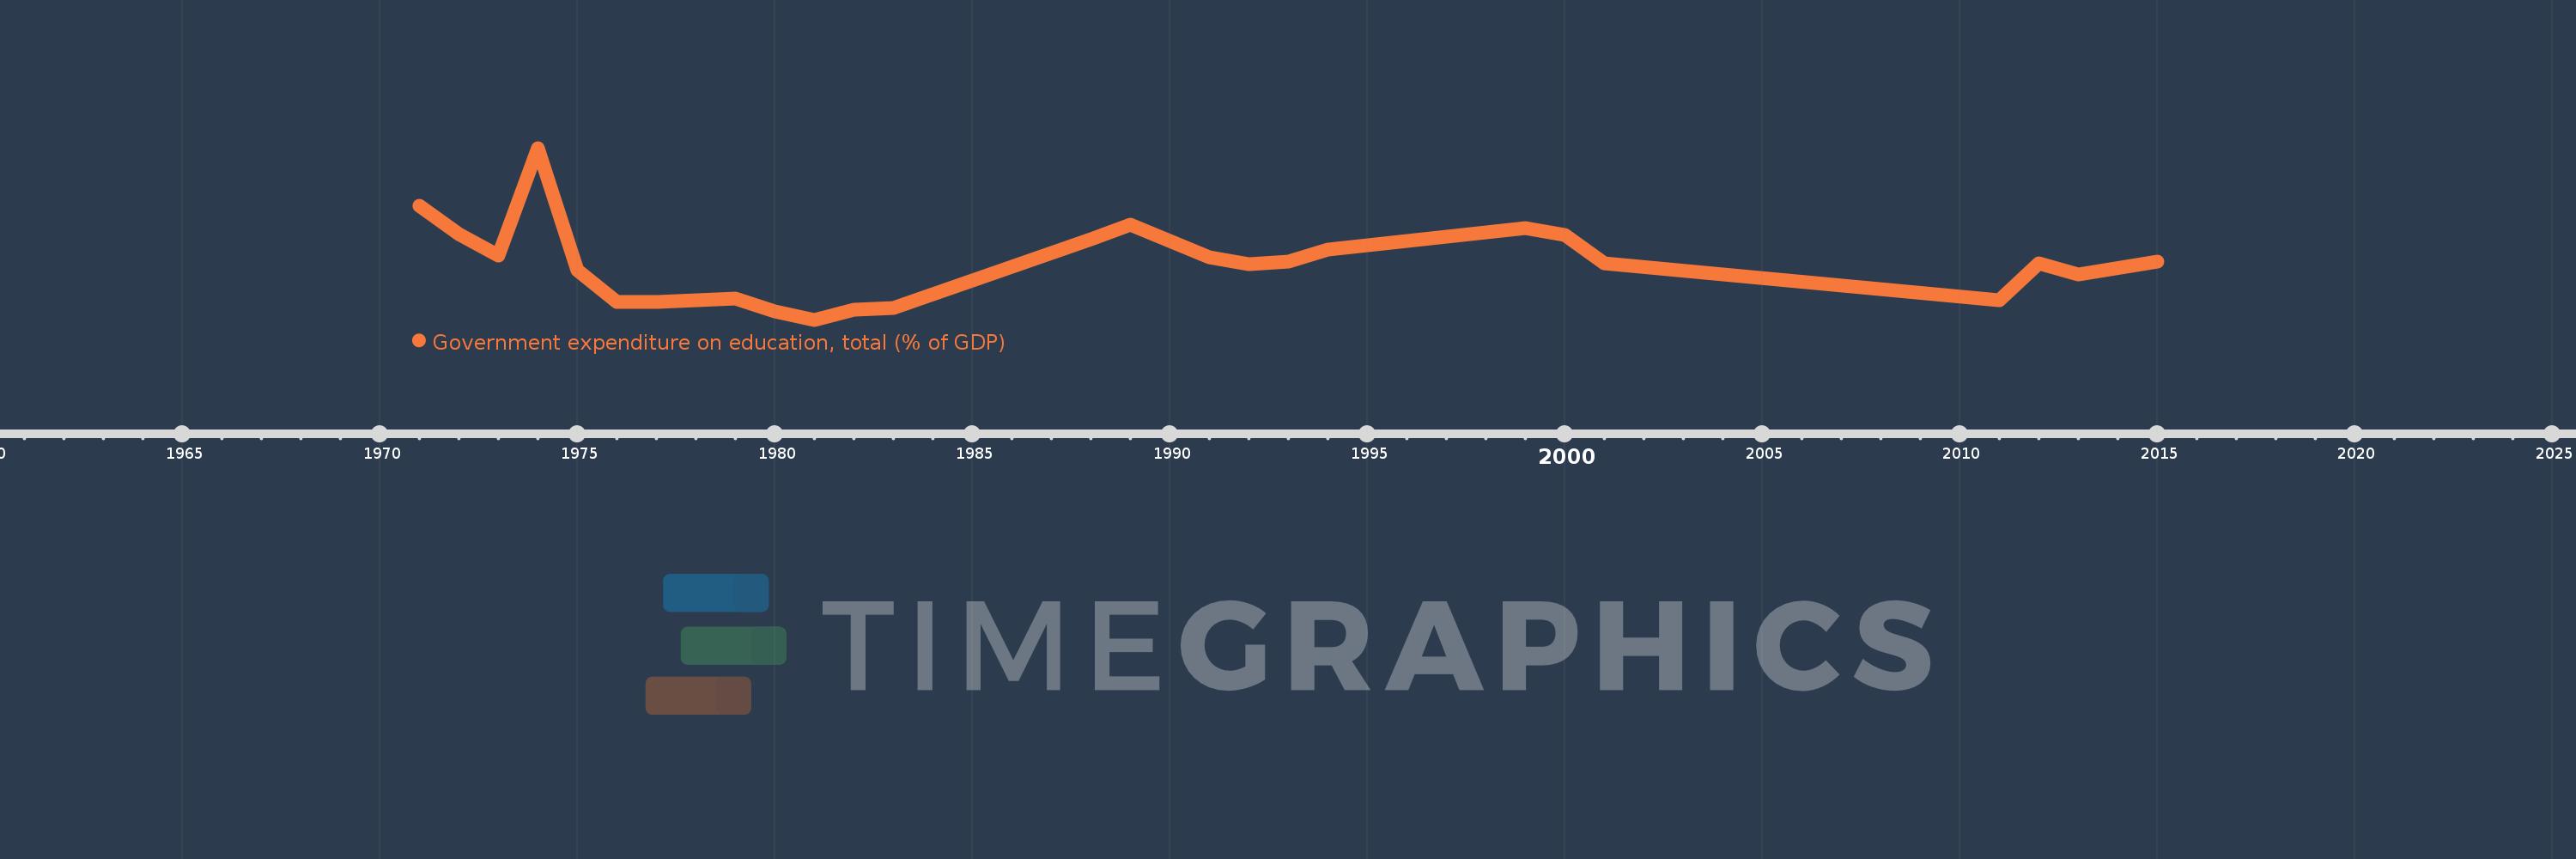
Government expenditure on education, total (% of GDP)
2015,2013,2012,2011,2001,2000,1999,1994,1993,1992,1991,1990,1989,1988,1983,1982,1981,1980,1979,1977,1976,1975,1974,1973,1972,1971