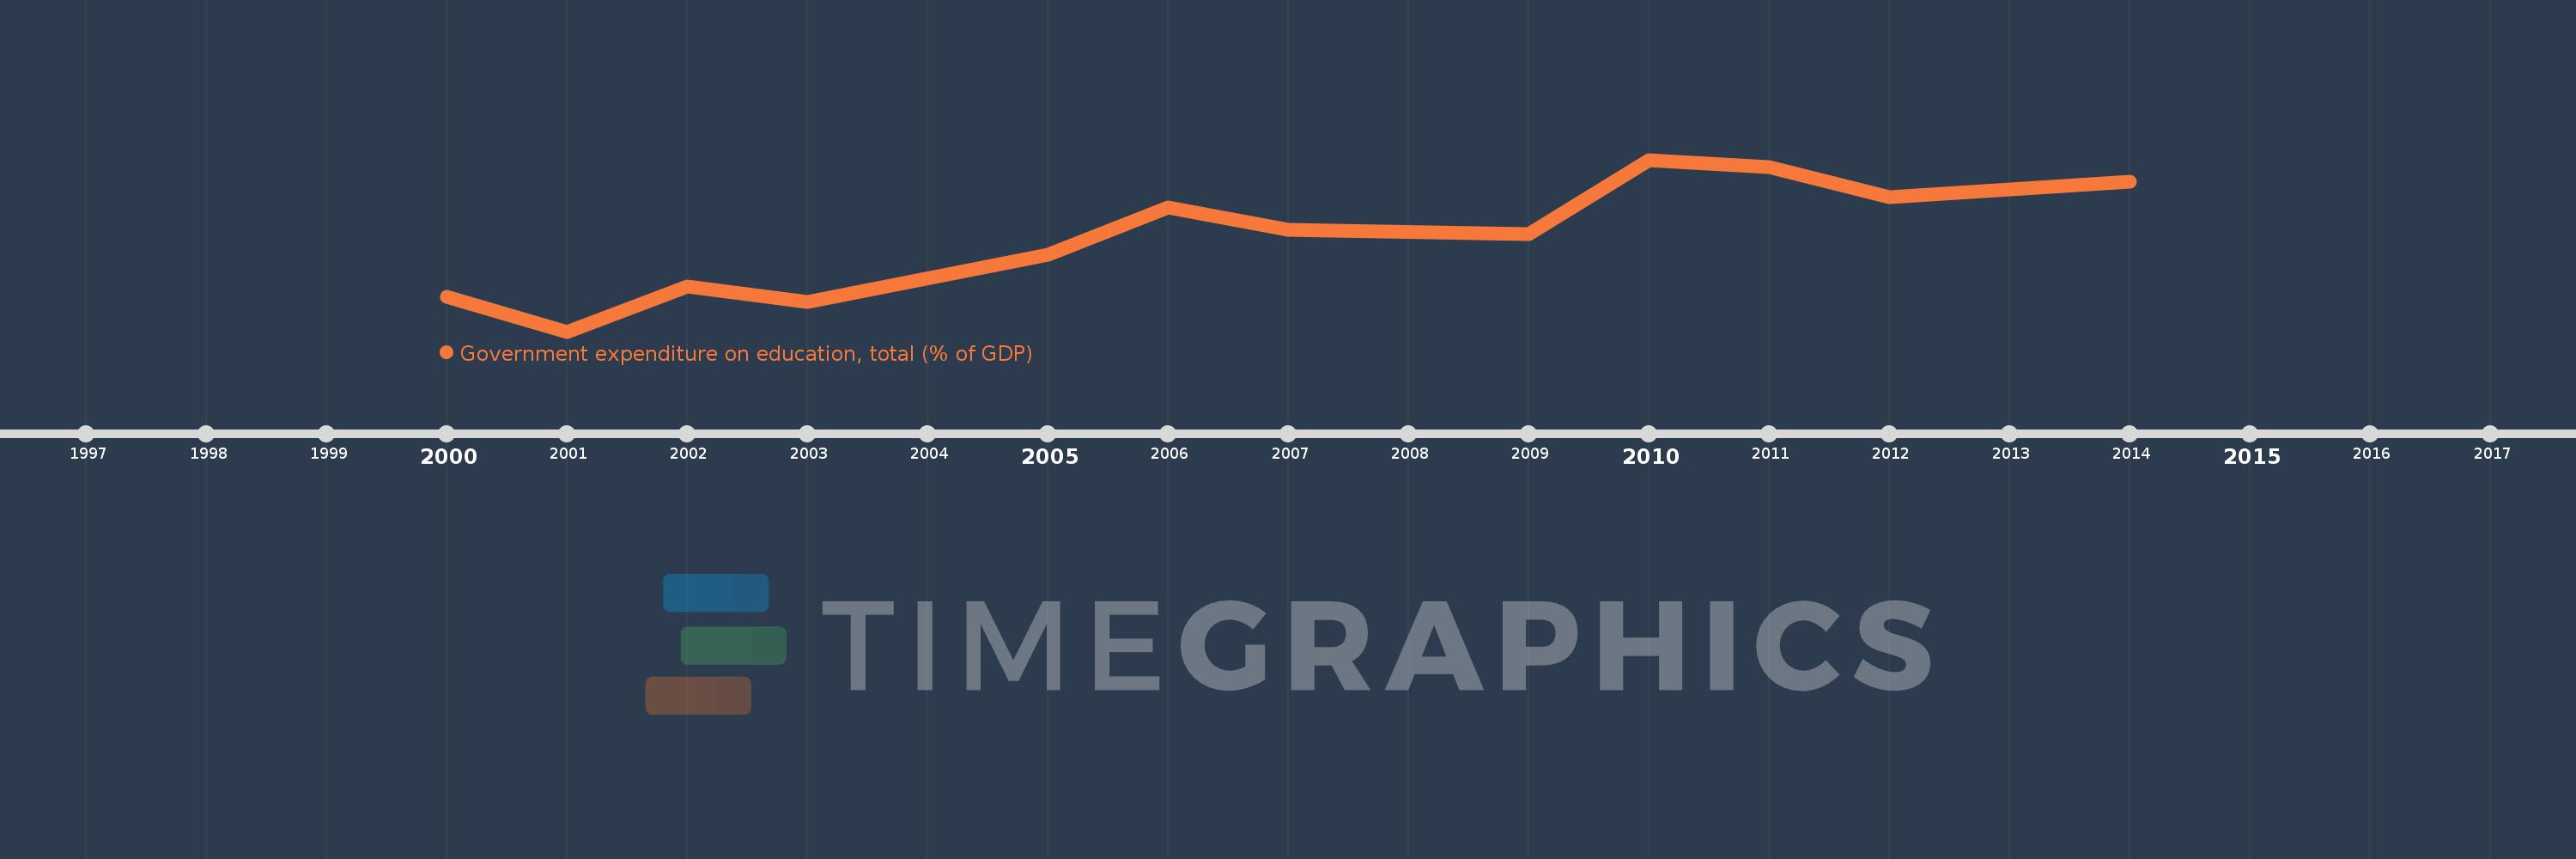
This timeline shows a graph from 2000 to 2014 of Sub-Saharan Africa (IDA & IBRD countries). No data until 1999. Number of actual observations by date: 12.
Source name:
World Development Indicators
Source organization:
United Nations Educational, Scientific, and Cultural Organization (UNESCO) Institute for Statistics.
Categories, topics:
Education
Last updated:
apr 23, 2017
Indicators value changes by year
Meaning:
3.705
Minimum:
3.248
jan 1, 2001
Maximum:
4.08
jan 1, 2010
At the date of observation
Value
Absolute change
Change from the previous value
jan 1, 2000
3.417
+3.417
0.0%
jan 1, 2001
3.248
-0.17
-4.97%
jan 1, 2002
3.468
+0.22
6.77%
jan 1, 2003
3.392
-0.076
-2.18%
jan 1, 2005
3.622
+0.23
6.77%
jan 1, 2006
3.848
+0.227
6.26%
jan 1, 2007
3.741
-0.107
-2.79%
jan 1, 2009
3.722
-0.018
-0.49%
jan 1, 2010
4.08
+0.357
9.6%
jan 1, 2011
4.046
-0.034
-0.82%
jan 1, 2012
3.899
-0.147
-3.63%
jan 1, 2014
3.974
+0.075
1.91%
Ranking of countries by current statistics by years