33
/
AIzaSyB4mHJ5NPEv-XzF7P6NDYXjlkCWaeKw5bc
November 30, 2025
201607
Morocco
MAR
true
2
1
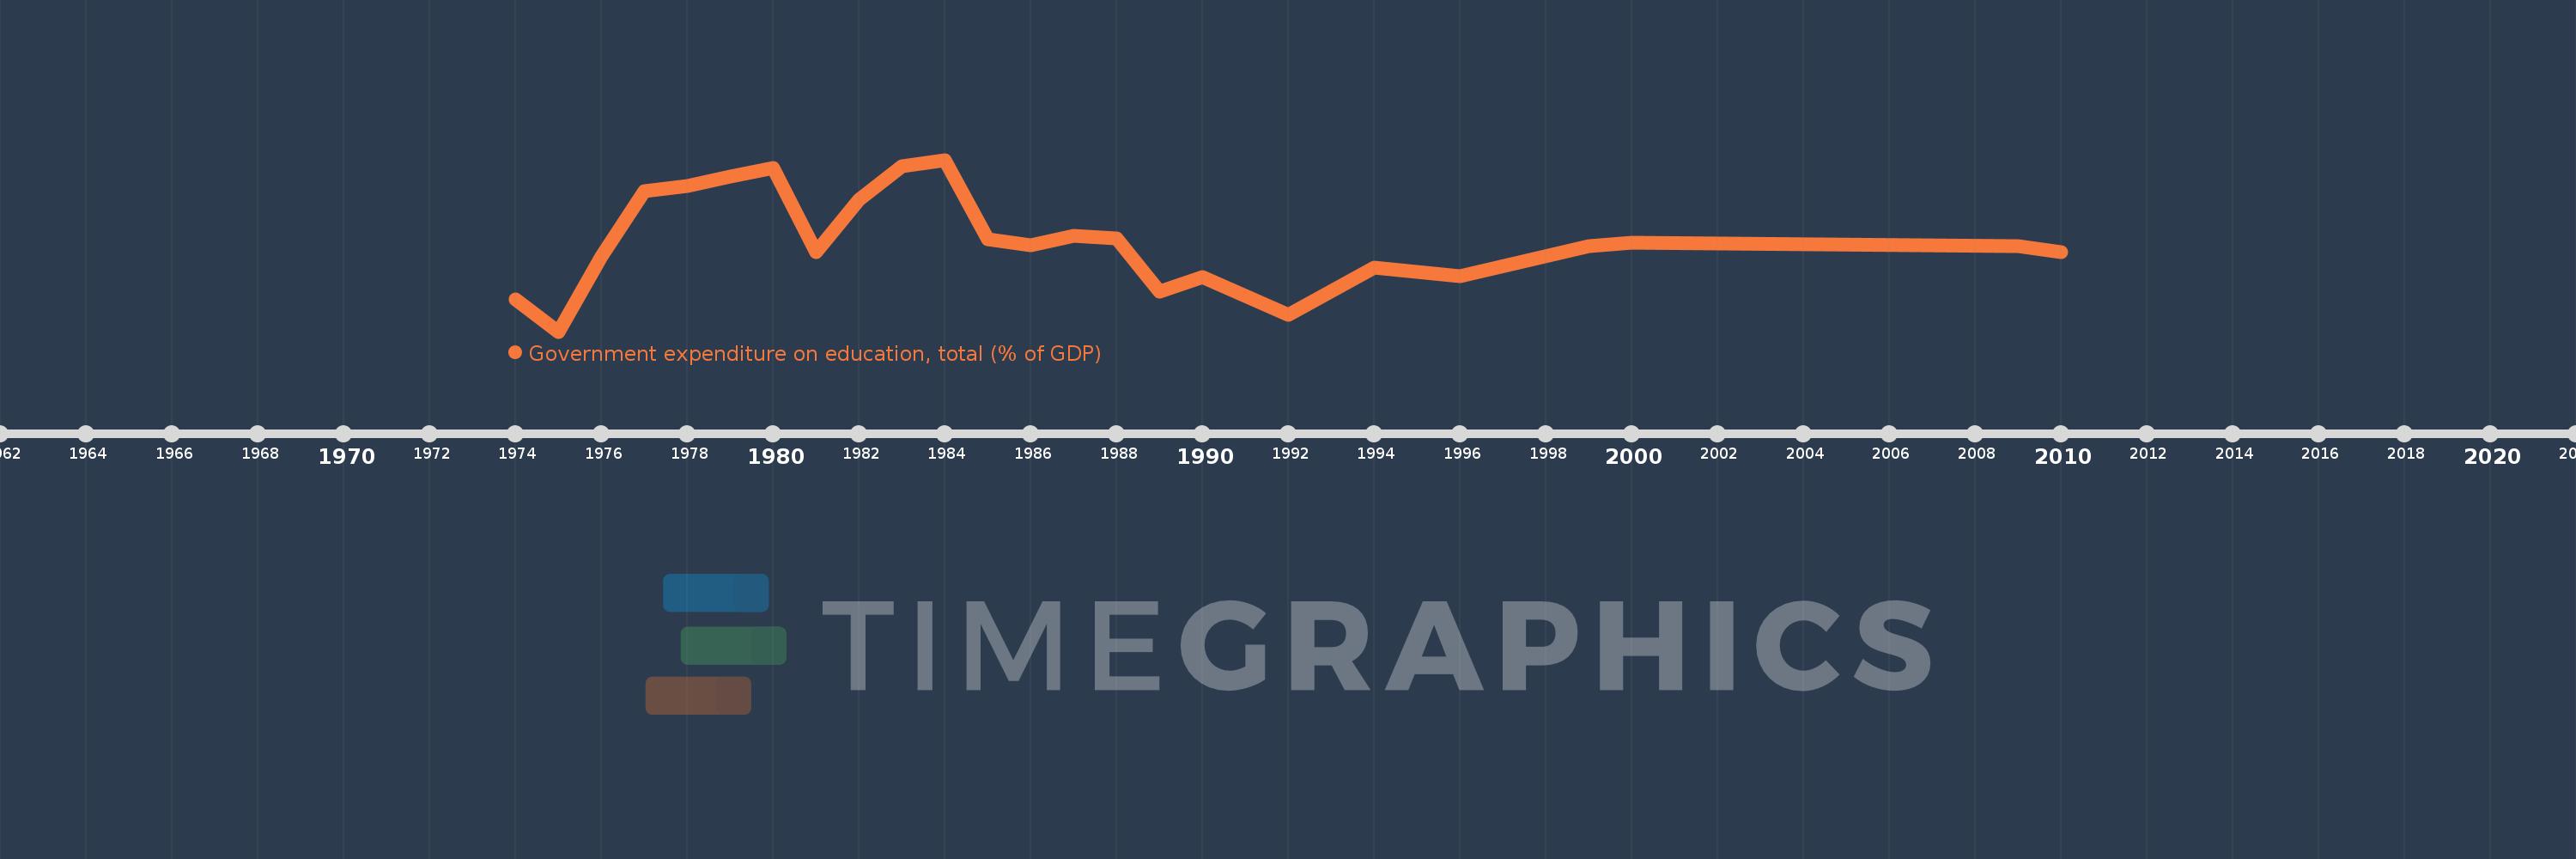
Government expenditure on education, total (% of GDP)
2010,2009,2000,1999,1996,1994,1992,1991,1990,1989,1988,1987,1986,1985,1984,1983,1982,1981,1980,1979,1978,1977,1976,1975,1974