33
/
AIzaSyB4mHJ5NPEv-XzF7P6NDYXjlkCWaeKw5bc
November 30, 2025
171737
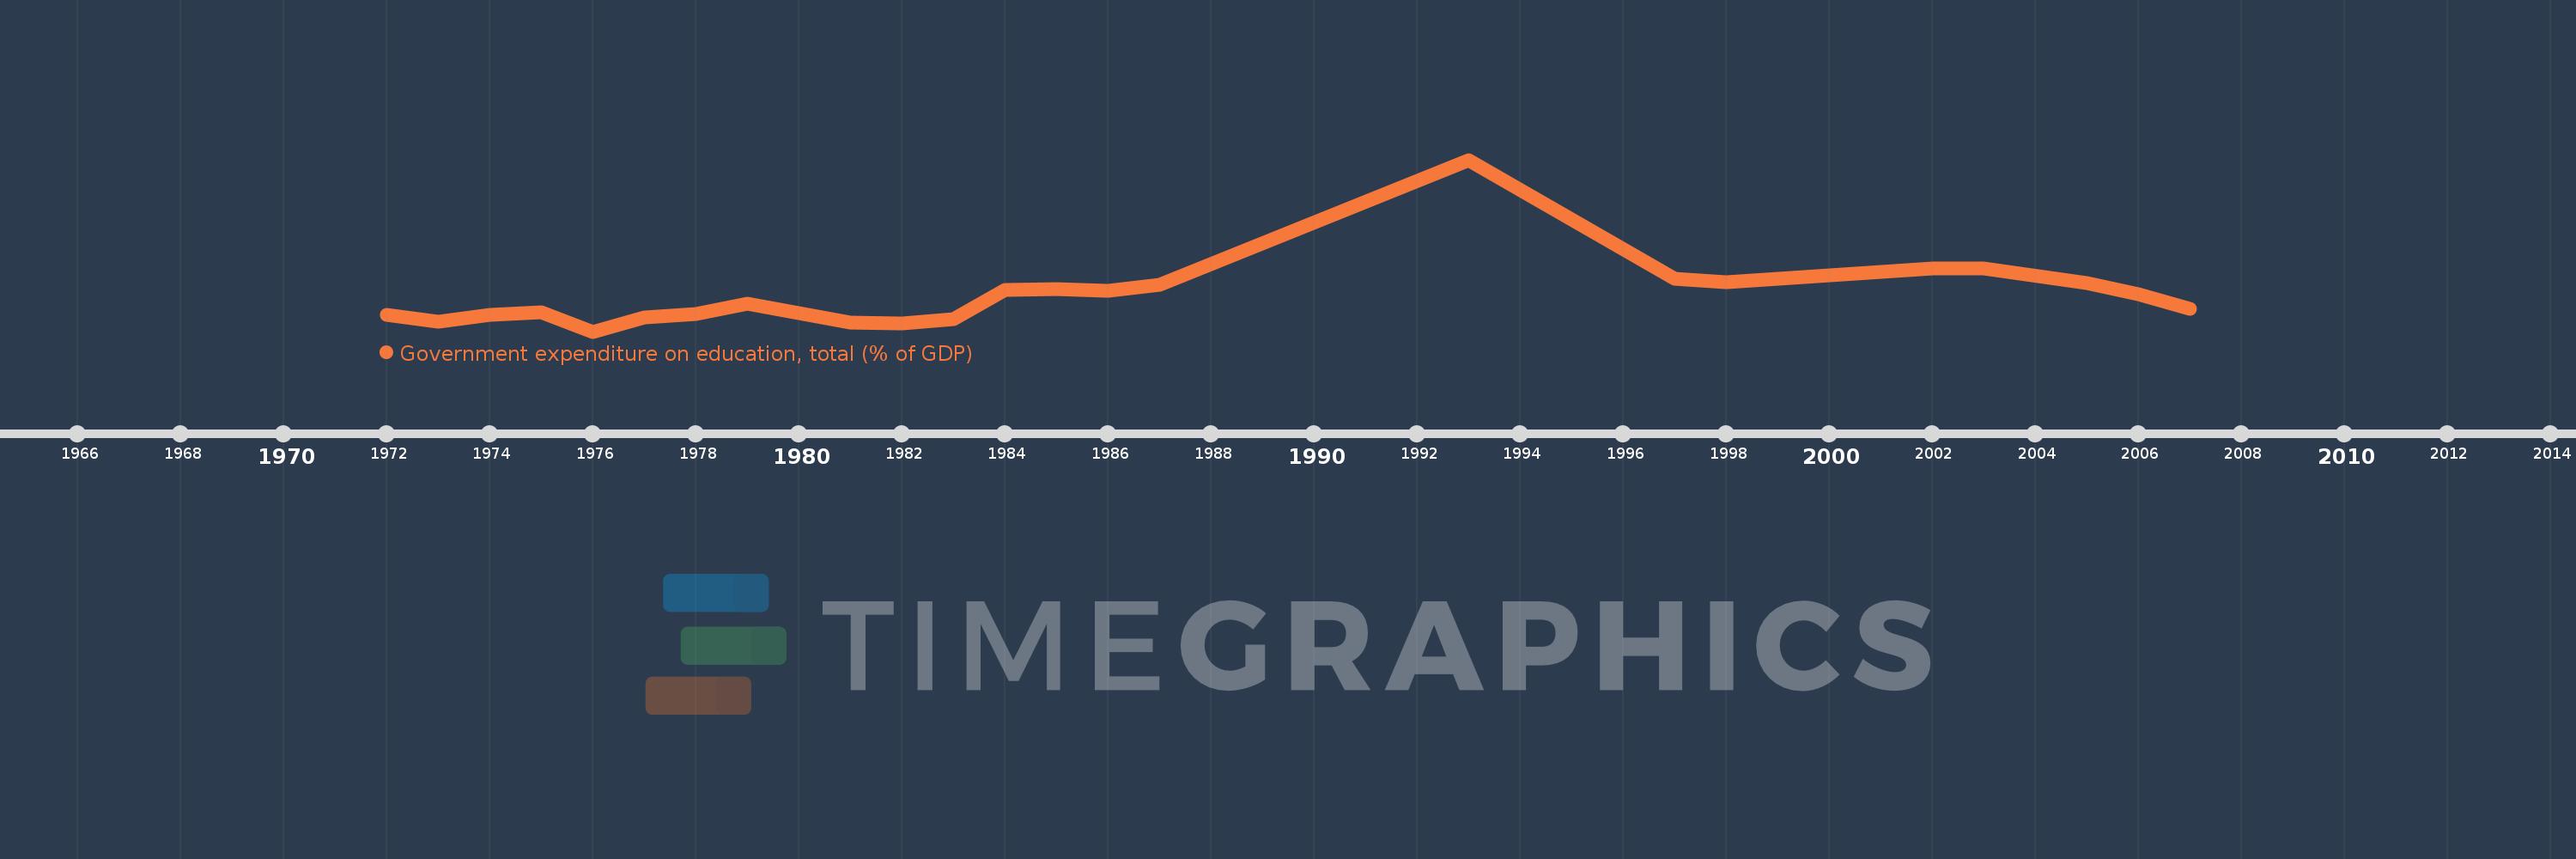
Kuwait
KWT
true
2
1
Government expenditure on education, total (% of GDP)
2007,2006,2005,2003,2002,1998,1997,1993,1987,1986,1985,1984,1983,1982,1981,1980,1979,1978,1977,1976,1975,1974,1973,1972